
Figure 1.
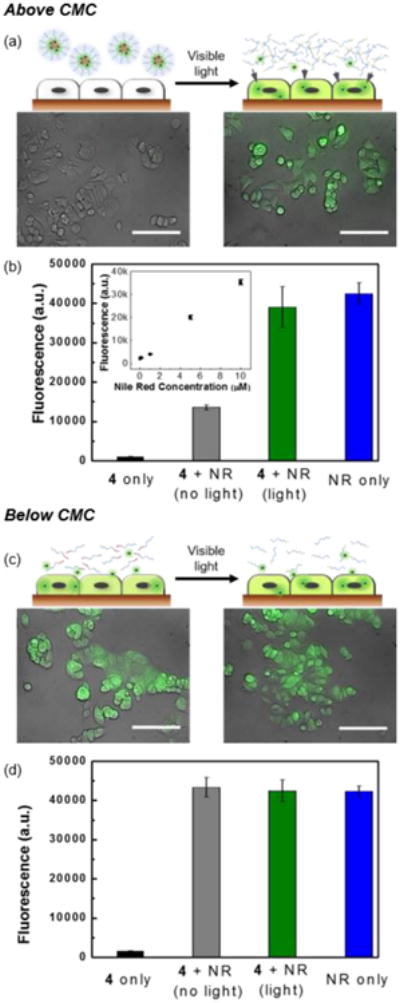
Visible light-mediated cargo delivery of Nile Red (NR) into MCF-7 cells above (a and b) and below (c and d) CMC. (a) Schematic of cells incubated with DASA-amphiphile 4 above CMC before (top left) and after (top right) visible light irradiation. Corresponding fluorescence microscopy images of MCF-7 cells. (bottom). Scale bar= 100 μm. (b) Linear relationship of cell fluorescence intensity to Nile Red concentration (inset). Fluorescence measurement of Nile Red in MCF-7 cells. (c) Schematic of cells incubated with DASA-amphiphile 4 below CMC before (top left) and after (top right) visible light irradiation. Corresponding fluorescence microscopy images of MCF-7 cells (bottom). Scale bar= 100 μm. (d) Fluorescence measurement of Nile Red in MCF-7 cells.