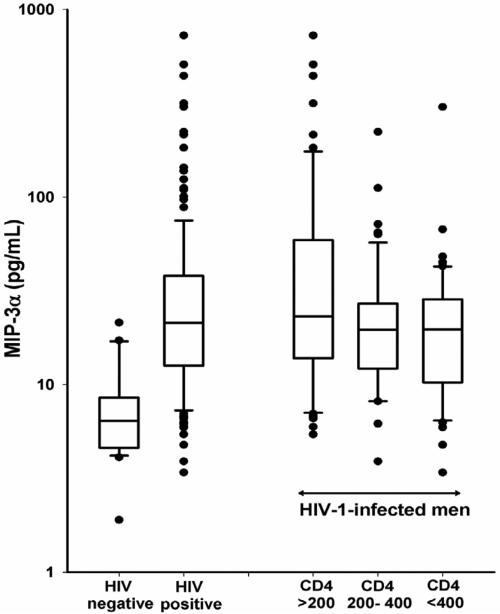
Figure 1.
log10 transformed serum concentrations of CCL20/MIP-3α in HIV-1 negative men and HIV-1 positive men with CD4+ T cell counts <200, between 200 and 400 and >400 cells/μL. The solid lines represent the median and the box represents the 25th to 75th percentiles. Individual outlying data points are presented as filled black circles.

