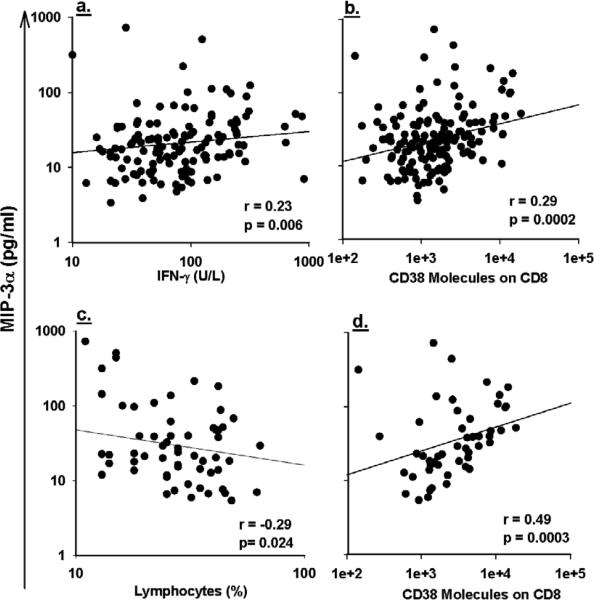
Figure 3.
Positive correlation between log10 transformed serum concentrations of CCL20/MIP-3α and log10 transformed of IFN-γ (a), positive correlation with log10 transformed of number of CD38 molecules on CD8+ T cells (b) shown all HIV-1-infected in the study. Negative correlation between log10 transformed serum concentrations of CCL20/MIP-3α and percentage of lymphocyte (c) and positive correlation with log10 transformed of number of CD38 molecules on CD8+ T cells(d) shown for HIV-1-infected men with CD4+ T cell counts <200 cell/μL.

