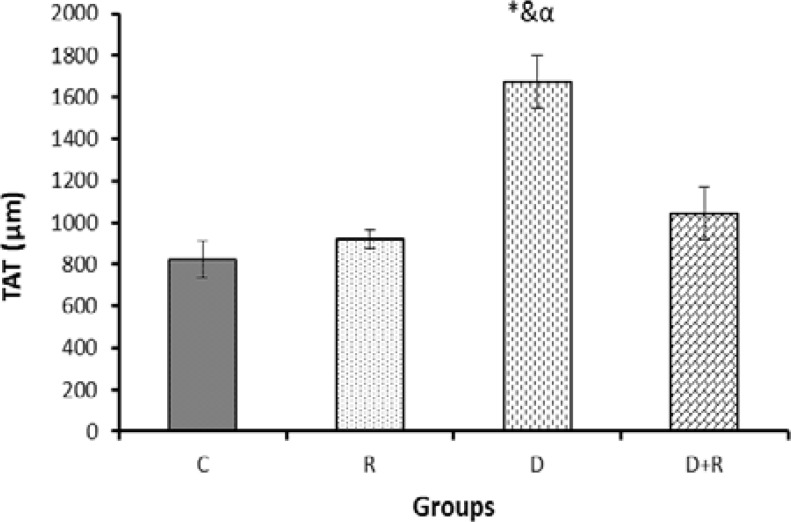
Figure 1.
The thickness of tunica albuginea (TAT) measured by histological examinations of the testicular tissue in different groups.
Data are presented as mean ±SE.
*p<0.05 compared to C group. &: compared to R group. α: compared to D group. β: compared to D+R group.
TAT: Tunica albugina thickness
C: Control group
R: Royal jelly groups
D: Diabetic group
D+R: Royal jelly-treated diabetic group.

