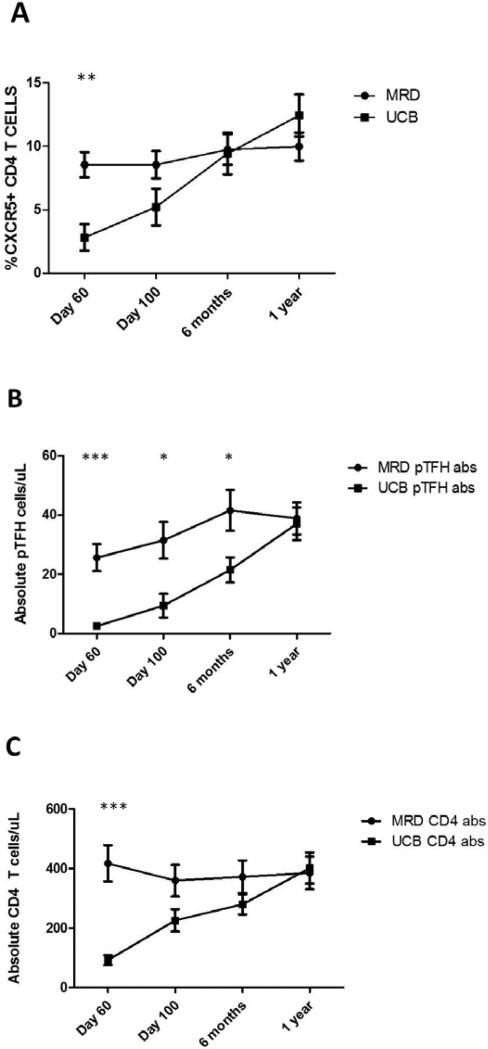
Figure 2. The pTFH population expands in UCB recipients while the pTFH population remains stable in MRD recipients.
A) Quantification of pTFH cells (CD3+CD4+CXCR5+) in patients undergoing UCB (n=15) or matched sibling PBSC/BM transplantation (n=15) at day 60, day 100, 6 months, and 1 year post-transplantation. At day 60 post-transplant, UCB recipients had significantly lower percentages of pTFH cells compared to MRD transplant recipients (8.5% ± 1.0 vs 2.8% ± 1.0. ***p value 0.001, Mann-Whitney t-test). B-C) Absolute numbers of pTFH (B) and CD4 T cells (C) in MRD and UCB recipients displayed in panel A. There are significantly more pTFH cells in MRD recipients at day 60 (25.6 ± 4.5 vs 2.5 ± 0.7. ***p value 0.001), day 100 (31.5 ± 6.2 vs 9.4 ± 4.0. *p value 0.02), and 6 months (41.6 ± 6.9 vs 21.5 ± 4.2. *p value 0.02) compared to UCB recipients. There are significantly more CD4 T cells in MRD recipients at D60 following transplant (417.5 ± 60.6 vs 92.2 ± 18.8. ***p value 0.001) compared to UCB recipients.

