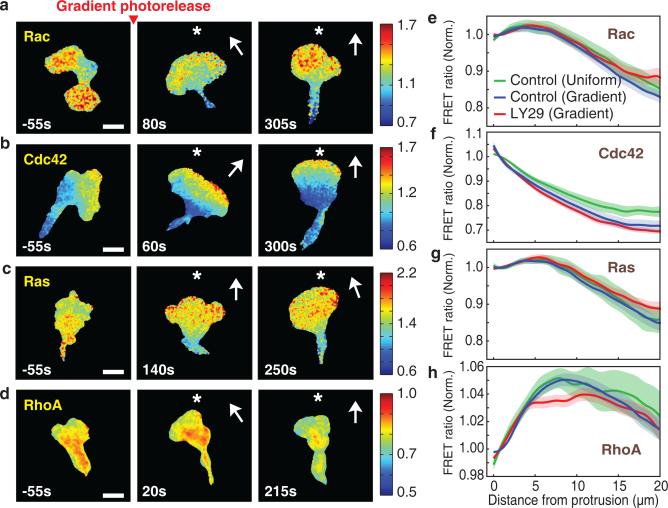
Figure 2.
Cdc42 and opposing RhoA activities are steeply polarized at the front. (a-d) Spatial activity profiles of Rac (a), Cdc42 (b), Ras (c), and RhoA (d) in a light-induced gradient of fMLF gradient (approximately 8% across a cell). Time relative to gradient stimulation is marked and the direction of the chemoattractant gradient is indicated with a *. Color bars indicate the range of biosensor FRET ratios. Scale bar is 10μm. (e-h) Relative activities of Rac (e), Cdc42 (f), Ras (g), and RhoA (h) in migrating cells as a function of distance backwards from the leading edge. Values are normalized to the levels at the front edge. Error bars indicate ± s.e.m. of n=10 (Rac control uniform), n=18 (Rac control gradient), n=18 (Rac LY29 (50μM) gradient), n=9 (Cdc42 control uniform), n=26 (Cdc42 control gradient), n=16 (Cdc42 LY29 (50μM) gradient), n=13 (Ras control uniform), n=19 (Ras control gradient), n=23 (Ras LY29 (50μM) gradient), n=10 (RhoA control uniform), n=44 (RhoA control gradient), and n=14 (RhoA LY29 (50μM) gradient) cells. Time averaged gradients are shown including all cells measured for each GTPase.

