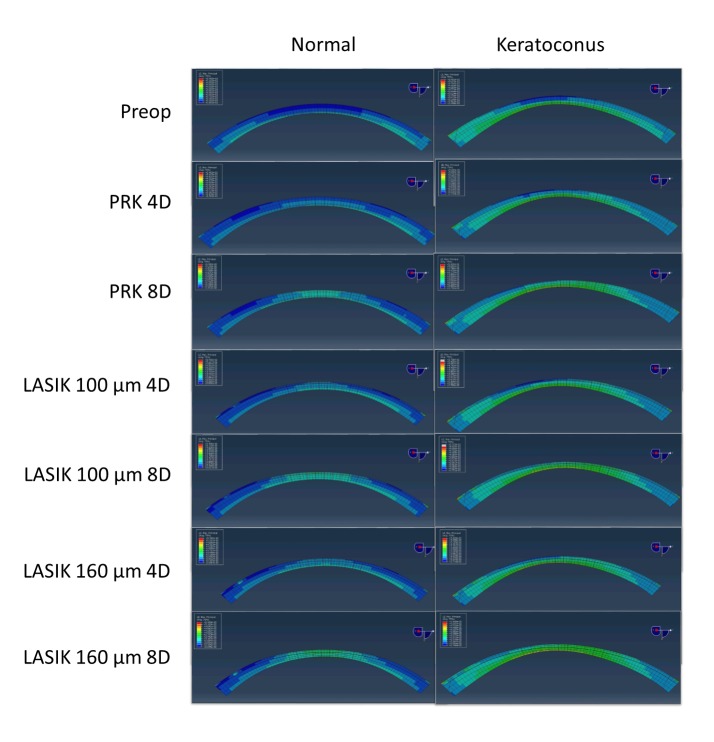
FIGURE 2.
Illustrative maps of maximum principal strain values in central cross sections of serial surgical simulations on a normal pre-LASIK eye (left column) and a keratoconic eye (right column). Higher strains are evident in the keratoconic eye across all surgical procedures and in the preoperative model. D = Diopters of myopic treatment, µm = micrometers of flap thickness. Color scales are normalized across all images for comparability, and simulations were performed at a standardized intraocular pressure load (15 mmHg) with an assumption of identical material property constants in all eyes. Cool colors (blue) indicate lower strain values while warmer colors (green) indicate higher strain values.

