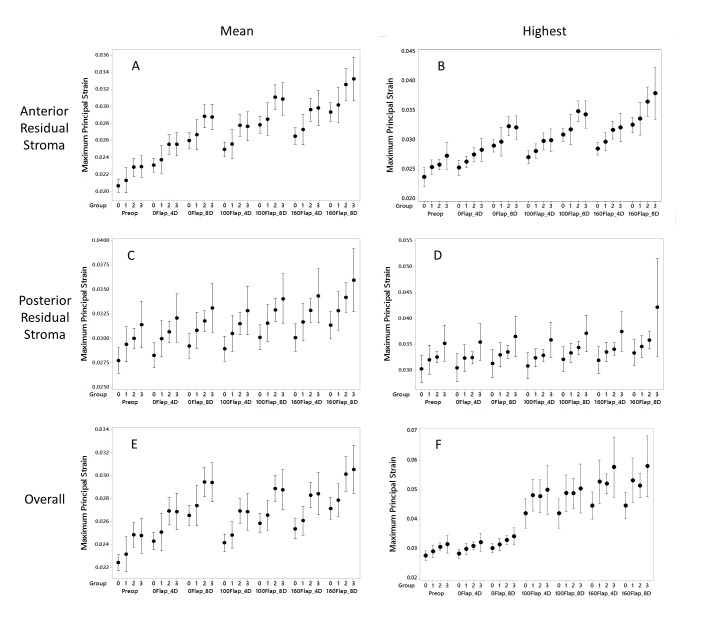
FIGURE 4.
Maximum principle strain values (dimensionless) for simulated PRK and LASIK procedures across 4 patient groups. Mean values (A, C and E) report the average of all maximal principal strain values across the specified analysis region, and highest values (B, D and F) provide the peak maximum principal strain value from each analysis region. Analyzed regions are either a 9mm wide surface along the anterior (A and B) or posterior (C and D) residual stroma or a 3-dimensional zone encompassing the full thickness of the cornea and spanning the central 5mm diameter (E and F). D = Diopters of attempted correction at the spectacle plane, Preop = preoperative models not yet subjected to surgical simulation, 0Flap = PRK, 100Flap = LASIK with a 100 micron flap, 160Flap = LASIK with a 160 micron flap. Clinical groupings of the patient cohort are represented on the x axis as follows: 0 = normal refractive surgery candidates who eventually underwent LASIK, 1 = atypical topographic patterns not categorized as keratoconus suspects, 2 = suspicious topographic patterns not characterized as manifest keratoconus but disqualified from LASIK, and 3 = manifest keratoconus. Means and 95% confidence intervals are displayed.

