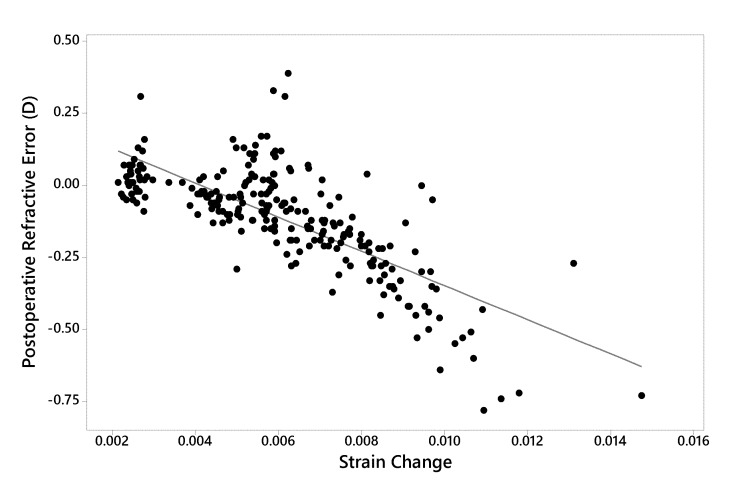
FIGURE 7.
Linear regression analysis demonstrating the relationship between postoperative refractive error (achieved – attempted) and strain change (postoperative – preoperative, dimensionless units) across all preoperative and myopic surgical simulations (R-squared = 56.7%, P<.001). D = Diopters. Strain quantity = mean maximum principal strain at the anterior residual stromal bed surface.

