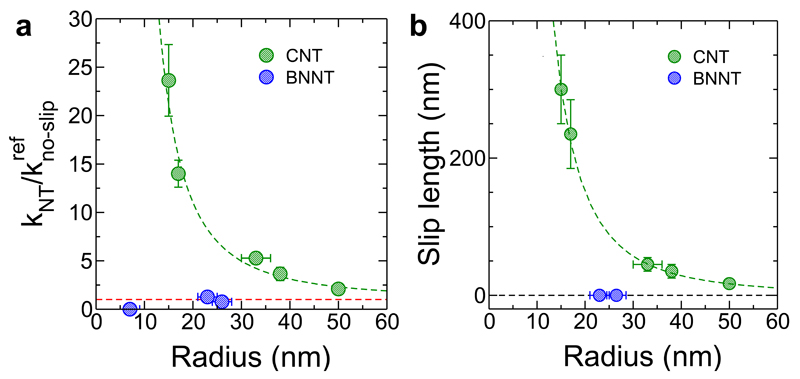
Figure 3. Permeability and slip length of individual CNTs and BNNTs.
(a) Normalized permeability of CNTs (green symbols) and BNNTs (blue symbols) as a function of Rt. The permeability of the Rt =7 nm BNNT was below the experimental detection limit and is indicated as kNT = 0 for completeness. Error bars correspond to the experimental errors on FP. (b) Rt dependence of the experimentally determined slip length inside CNTs (green) and BNNTs (blue). Error bars correspond to the uncertainty in the permeability. Salt concentration is Cs=10-3 M, except for the 33 nm CNT which was studied at both Cs=10-3 M and Cs=10-2 M without a detectable difference. In (a) and (b), the horizontal dashed line indicates the no-slip prediction and the green dashed line is a guide to the eye. The error bars on the radius correspond to the experimental uncertainty in the electric characteristics (see Supplementary Methods 2 and 4). The values of the slip lengths are reported in Supplementary Tables 2 and 3.

