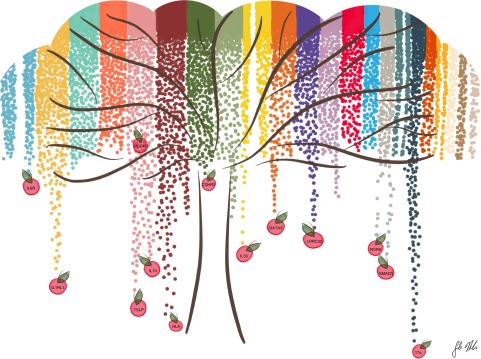
Figure 1.
Overview of results of genome-wide association studies (GWAS) for asthma. Figure is shown as a stylized inverted Manhattan plot, which was created on the basis of published data. Colors represent different autosomal chromosomes (1–22, left to right). Many asthma-associated loci have been discovered by GWAS. These associations are generally robust across ethnic and racial groups and represent the “low-hanging fruit” (shown as apples). However, separating signal from noise among the variants with small P values that do not reach the genome-wide criteria for significance (i.e., the “mid-hanging fruit” among the branches, not shown) remains challenging. These loci likely include many exposure-specific associations and may be validated using cell culture models of gene–environment interactions. Figure drawn by S. Mozaffari.

