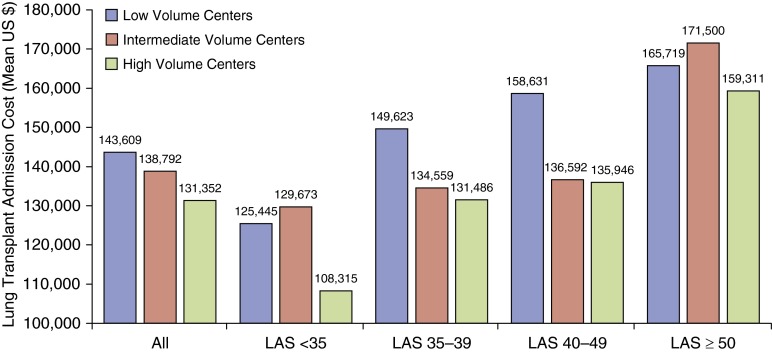
Figure 1.
Cost of lung transplant admission by transplant center volume. The mean unadjusted cost for the index lung transplant admission is shown for low-, intermediate-, and high-volume centers stratified by all recipients and by recipients at various lung allocation score (LAS) thresholds. P values for within-group comparisons are as follows: All, P < 0.0001; LAS < 35 subgroup, P < 0.0001; LAS 35–39 subgroup, P = 0.0036; LAS 40–49 subgroup, P = 0.0142; LAS ≥ 50 subgroup, P = 0.1109.

