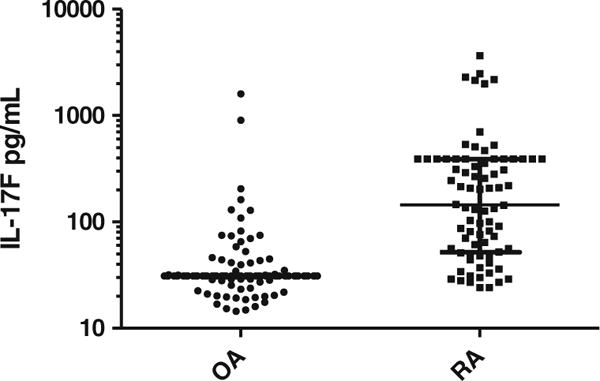
Fig. 1.

Plasma IL-17F concentrations in RA patients versus OA patients. Above depicts plasma IL-17F concentrations in OA patients (controls) and RA patients. Data presented as median (longest horizontal bar) and interquartile range (smaller horizontal bars) each dot is an individual patient. Of note, the interquartile range is quite small for OA patients. RA rheumatoid arthritis, OA osteoarthritis.
