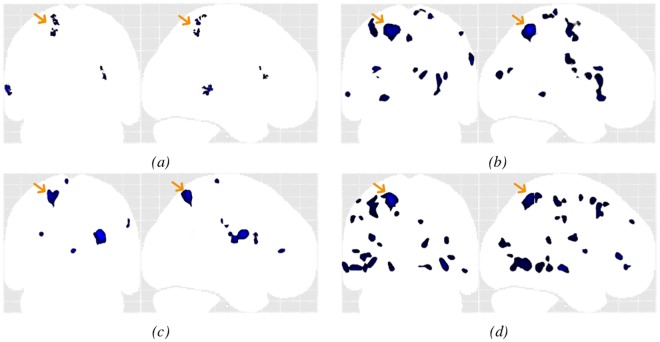
Fig 10. Example MIP of the detected cluster maps (blue) for patient #10 (MRI-), the presumed lesion is indicated with the yellow arrow.
(a) OC-SVM distance map thresholded at p < 0.001; (b) SPM analysis based on the T-score map from the conjunction of both contrasts thresholded at p < 0.001 (c) SPM junction-based T-score map thresholded at p < 0.001; (d) SPM extension-based T-score map thresholded at p < 0.001.

