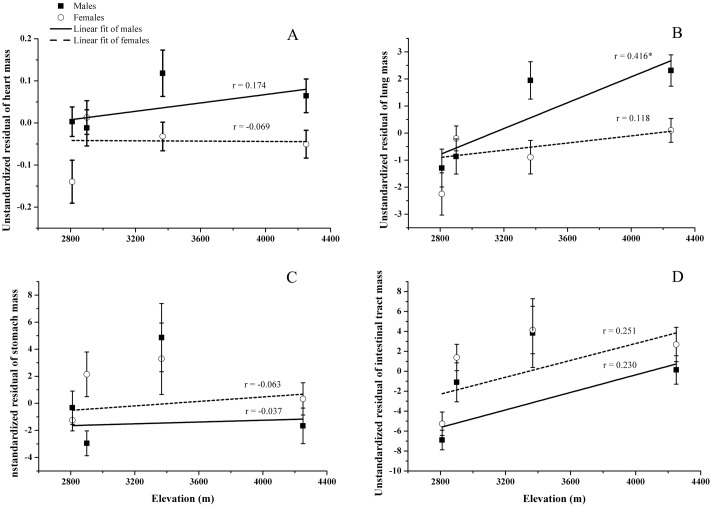
Fig 2. Altitudinal variation of Phrynocephalus vlangalii organ mass in the Qinghai-Tibet Plateau, China.
(A) heart, (B) lung, (C) stomach, (D) intestinal tract. The effect of body mass was eliminated using the unstandardized residuals obtained from the linear regression analysis performed for each organ. Black squares and empty circles represent the means for males and females, respectively, and the error bar represents the standard error. The solid and dotted lines represent the fitting of organ mass to altitude for males and females, respectively. The coefficients of the linear regression analysis are displayed above lines and the asterisk (*) denotes P < 0.05.

