Figure 1.
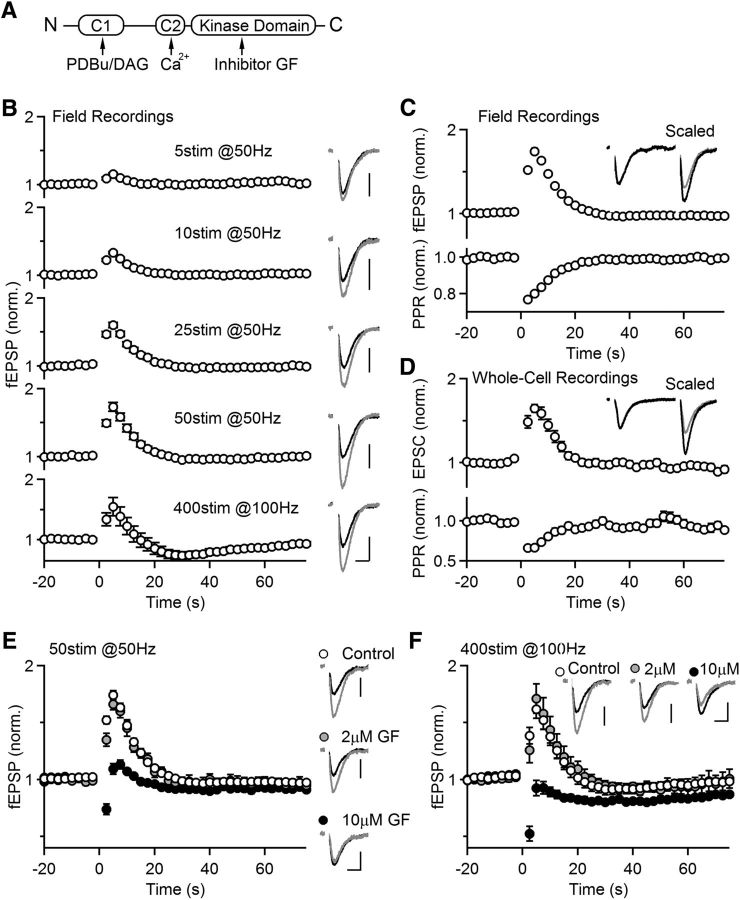
Effects of PKC inhibitor on post-tetanic potentiation (PTP) at Hippocampal CA3→CA1 synapses. A, Domain structures of Ca2+-dependent PKC isoforms (classical PKCs). B, CA3 to CA1 synapses were stimulated at 0.4 Hz and synaptic responses were measured with an extracellular electrode. As indicated, different protocols were used to induce PTP with tetanic stimulation time t = 0. Left, Average normalized field EPSPs (fEPSPs). Right, representative traces of the averages of baseline responses (black) and the first three responses after tetanic stimulation (gray). These five protocols were used in the same slice, and three to five trials per protocol were recorded for the average (n = 12, 4; 12 slices from 4 animals, denoted similarly in other figures). Scale bar: 0.2 mV, 10 ms. C, Similar experiments were conducted as in A using the tetanic protocol 50 stim at 50 Hz to induce PTP, but with paired stimulation (Δt = 50 ms) to monitor the paired-pulse ratio (PPR). Inset, Scaled representative traces of the averages of baseline responses (black) and the first three responses after tetanic stimulation (gray; n = 47, 16). D, Similar experiments as in B, but with whole-cell voltage-clamp recordings from CA1 neurons (n = 29, 10). E, PTP induced at CA3→CA1 synapses was monitored with or without the presence of broad spectrum PKC inhibitor GF (2 or 10 μm; 1 h preincubation). Left, Average normalized fEPSPs. Right, representative traces of the averages of baseline responses (black) and the first three responses after tetanic stimulation (gray). (Control: n = 42, 15; 2 μm GF: n = 10, 2; 10 μm GF: n = 8, 2). Scale bar: 0.2 mV, 10 ms. F, Similar recordings as in E, but PTP was induced with 400 stimuli at 100 Hz (Control: n = 17, 7; 2 μm GF: n = 10, 2; 10 μm GF: n = 8, 2). Scale bar: 0.2 mV, 10 ms.

