Figure 3.

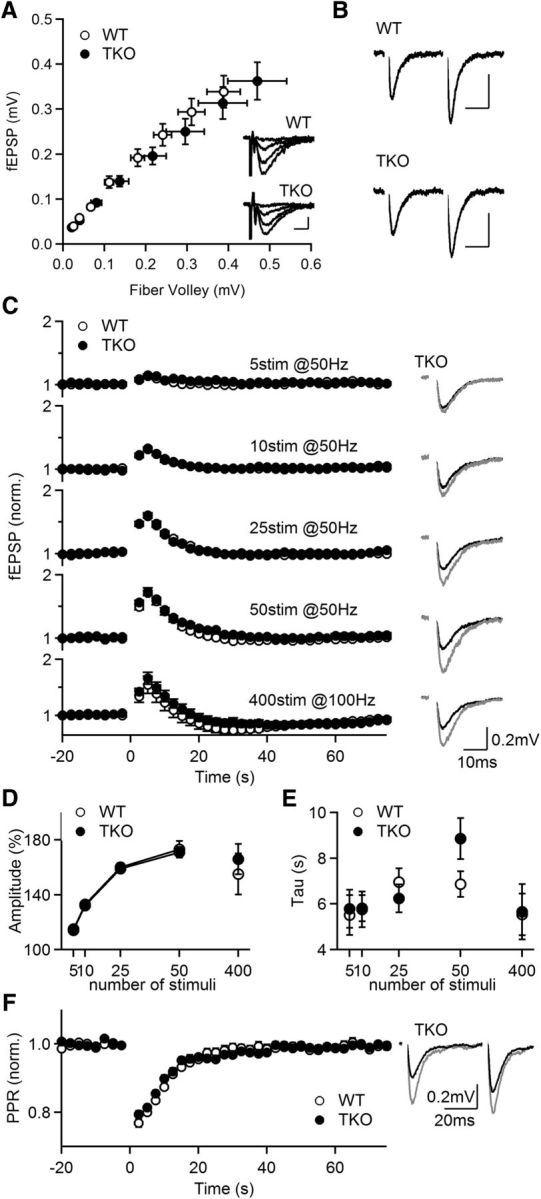
PTP at CA3→CA1 synapses is unaltered in PKCαβγ TKO animals. A, Averaged fEPSP amplitude plotted against fiber volley amplitude, for stimuli between 10–80 μA. Inset, Example extracellular recordings evoked by a range of stimulus intensities in WT and PKC TKO slices. Stimulus intensities from top: 10, 30, 50, and 70 μA, respectively. Scale bar: 0.2 mV, 5 ms. B, Representative traces of paired stimulation (Δt = 50 ms) evoked in WT and TKO slices. WT PPR: 1.68 ± 0.04, n = 22; TKO PPR: 1.66 ± 0.03, n = 34. p = 0.7. Scale bar: 0.2 mV, 20 ms. C, Normalized fEPSPs as a function of time for the indicated induction protocols in WT (open symbols; n = 12, 4) and TKO (filled symbols; n = 9, 3). Right, representative traces of the averages of baseline responses (black) and the first three responses after tetanic stimulation (gray). D, Amplitude of PTP induced by a train consisting of 5–50 stimuli at 50 Hz and for 400 stimuli at 100 Hz. E, Comparison of PTP time course induced using different protocols in WT and TKO slices. F, Similar experiments as in A using the tetanic protocol 50 stimuli at 50 Hz to induce PTP, but with paired stimulation (Δt = 50 ms) to allow for the monitoring of the PPR. Left, Average normalized fEPSP. Right, representative traces of the averages of baseline responses (black) and the first three responses after tetanic stimulation (gray; n = 36, 14).
