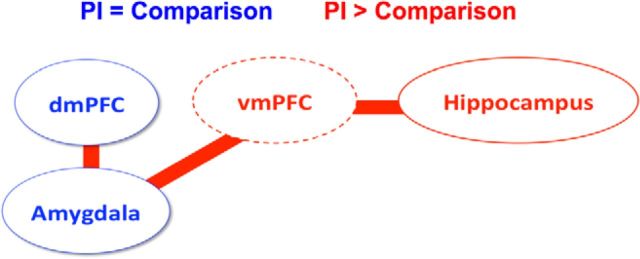
Figure 4.
Schematic of brain regions engaged during aversive learning in comparison and PI youth (circles, activation; lines, connectivity). Blue colors indicate comparable activation or connectivity for PI and comparison youth. Red colors indicate that the CS+ > CS− contrast of activation or connectivity was greater for PI youth than for comparison youth. The dotted line around vmPFC indicates that vmPFC was identified in connectivity but not activation analyses.

