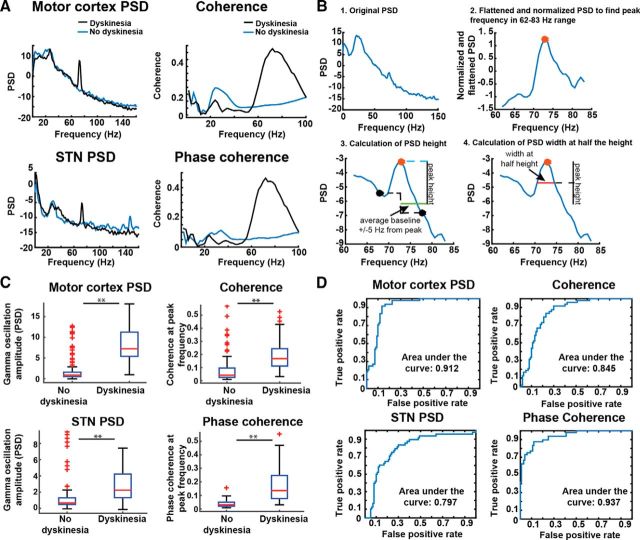
Figure 2.
Gamma oscillations distinguish the dyskinetic and nondyskinetic states. A, Example of motor cortex log PSD, STN log PSD, coherence, and phase coherence from Patient 2 at rest (all on medications). The PSD scale is 10 * log10(μV2/Hz). B, Schematic of PSD height and width calculation. Original PSDs (panel 1) were flattened and normalized (panel 2; see Materials and Methods) to identify the peak frequency in the 62–83 Hz range (red dot). The height of this peak was calculated by subtracting the original log PSD value at this frequency (red dot) from the average of the PSDs 5 Hz above and below the peak frequency (black dots, average indicated with green line). The height is indicated with the vertical black line (panel 3). The width of the peak at half the height was also calculated (red line, panel 4). For coherence, the maximum coherence in the 62–83 Hz range was used as the height. C, Group analysis for peak gamma amplitude. There was significantly higher gamma power during dyskinesia for each measure (Table 2). Data are displayed as boxplots, where center is median, box top and bottom are 25th and 75th percentiles, and whiskers reflect range of data excluding outliers. Outliers are denoted with plus signs. ** indicates p < 0.001. D, Receiver operating characteristic curves for each measure showing the false positive and true positive rates derived from fitting the data to a general linear model and examining rates for different classification threshold values for each biomarker.

