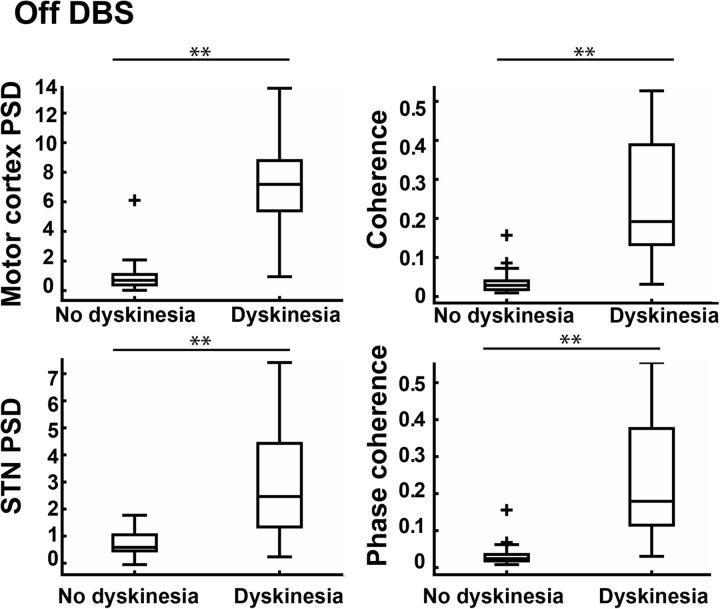
Figure 4.
Grouped data from Figure 2C for recording off DBS only. Values are significantly higher during dyskinesia for all measures, demonstrating that our findings are not driven by a stimulation artifact. p values reported in Table 3. Data are displayed with boxplots as in Figure 2C. ** indicates p < 0.001.

