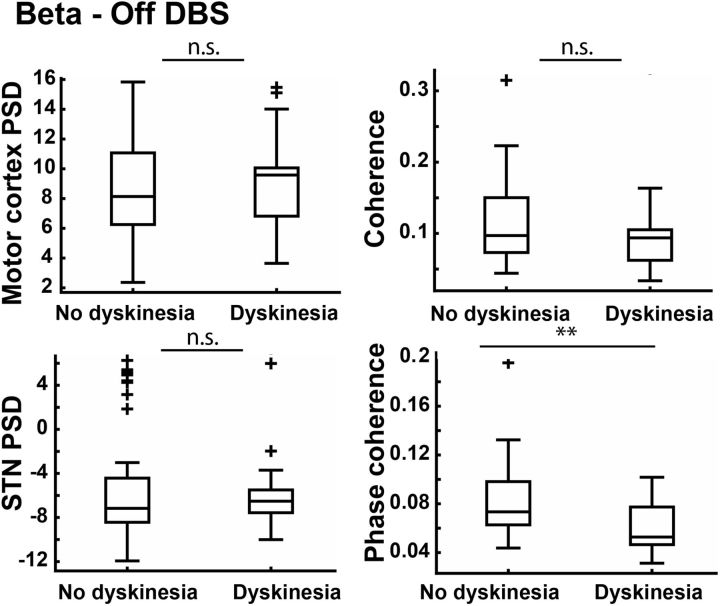
Figure 8.
Beta oscillations in the dyskinetic and nondyskinetic states. The figure shows a grouped analysis analogous to that shown in Figure 2C, except focusing on the beta range (13–30 Hz). This analysis includes only recordings with DBS off, to avoid artifacts caused by DBS subharmonics in the beta range. There are no significant differences except for decreased phase coherence between motor cortex and STN during dyskinesia (p = 7.24 × 10⁻⁴). Data are displayed with boxplots as in Figure 2C. ** indicates p < 0.001. n.s., Not significant.

