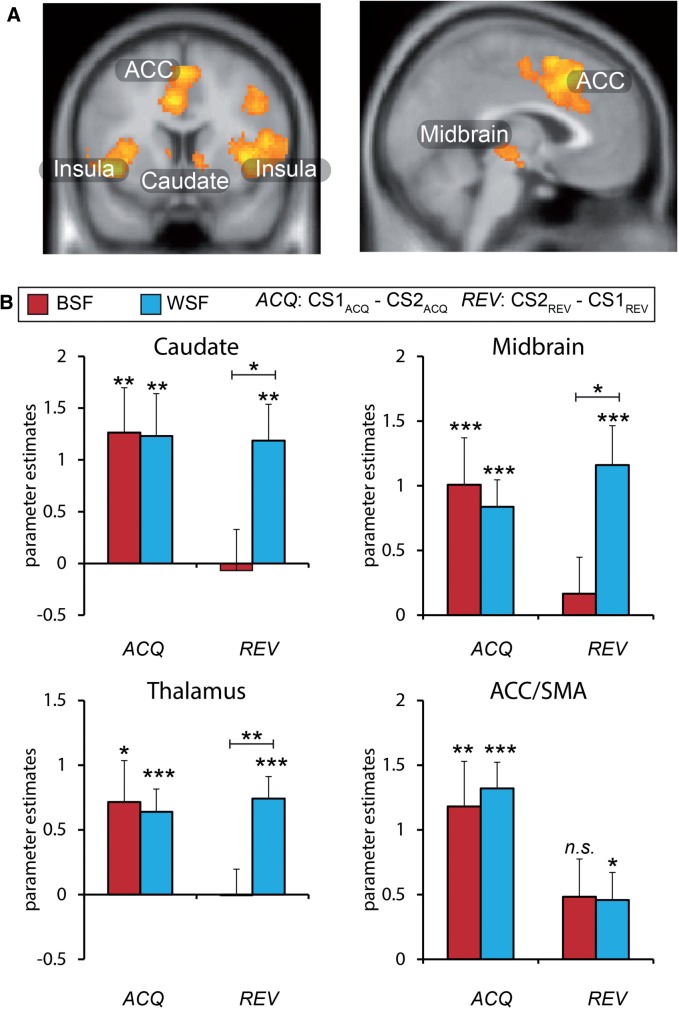
Fig. 3.
Neuroimaging results. (A) Regions exhibiting increased activity to the current threat cue versus the current danger cue. This analysis revealed clusters in the insula, midbrain, anterior cingulate (ACC) extending into the supplementary motor area (SMA), and caudate across participants (see Table 1 for full list of regions). (B) Mean parameter estimates from regions of interest show intact acquisition (ACQ) in both groups, but impaired reversals (REV) selectively in the BSF group. Error bars reflect standard errors; * P < 0.05; ** P < 0 .01; *** P < 0.001. Whole brain activity displayed at P < 0 .001, cluster corrected P < 0 .05. BSF = Black-Shocks-First group; WSF = White-Shocks-First group.

