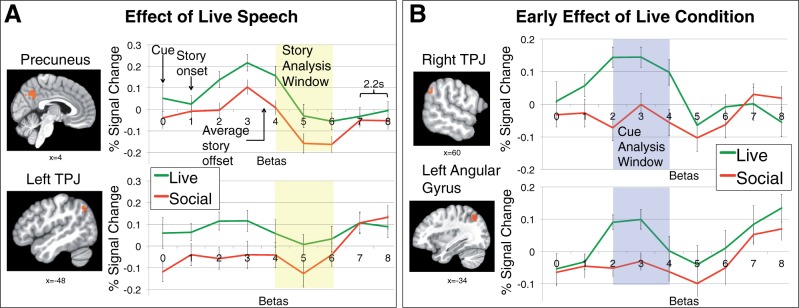
Fig. 2.
Time series plots for selected clusters defined from group-level comparisons (P < 0.05 corrected). Individual spline estimates vs baseline for a subset of regions defined by the (A) Live > Social comparison in the Story Analysis Window (Betas 4–6) and (B) Live > Social comparison in the Cue Analysis window (Betas 2-4). Error bars represent standard error of the mean. s, seconds; TPJ, temporal parietal junction (see also Table 2).

