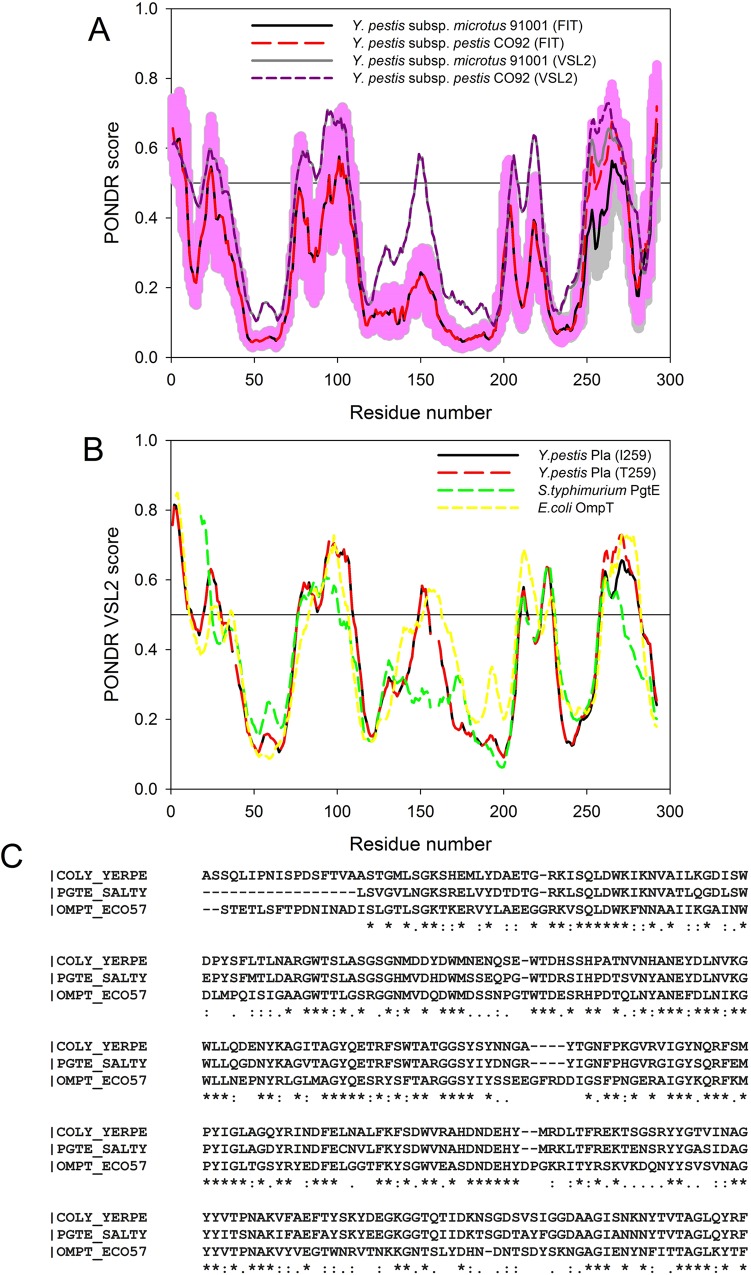
Fig 2. Evaluating intrinsic disorder propensities of different Caf1 isoforms.
(A) Disorder profiles obtained for the analyzed proteins by PONDR® VSL2 (Caf1NT1 (dashed dark yellow line), Caf1NT2 (solid gray line), and Caf1NT3 (dotted dark red line)) and PONDR-FIT (Caf1NT1 (dashed yellow line), Caf1NT2 (solid black line), and Caf1NT3 (dotted red line)). Disorder scores above 0.5 correspond to the residues/regions predicted to be intrinsically disordered. Colored shades around the corresponding PONDR-FIT curves represent distributions of errors in evaluation of disorder propensity. (B) Comparison of the disorder profiles obtained for Caf1 isoforms by PONDR VLXT (Caf1NT1 (dashed dark yellow line), Caf1NT2 (solid gray line), and Caf1NT3 (dotted dark red line)) and their intrinsic disorder-based interactability (Caf1NT1 (dashed yellow line), Caf1NT2 (solid black line), and Caf1NT3 (dotted red line)) predicted using the ANCHOR algorithm [51, 52]. To simplify comparison of disorder predisposition and presence of potential disorder-based binding sites, ANCHOR data are present in the (1 –ANCHOR score form). Therefore, in PONDR® VLXT profiles, regions with scores above 0.5 are predicted to be intrinsically disordered, whereas in the ANCHOR profiles, regions with probability below 0.5 are predicted as binding regions.

