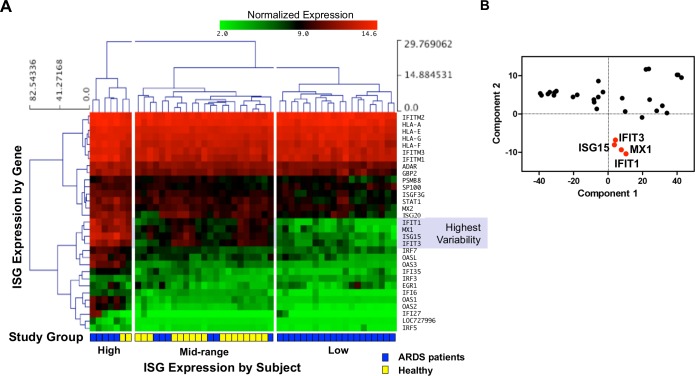
Fig 1. Transcriptome analysis to characterize ISG expression of ARDS patient and healthy control neutrophils.
(A) Log2-transformed expression of 31 unique transcripts within the Type I Interferon-mediated Signaling Pathway Cluster from neutrophils isolated from sepsis-induced ARDS patients (n = 31) and healthy volunteers (n = 19). ISG expression was ordered by hierarchical clustering (Euclidean distance with complete linkage), and contains only genes determined to significantly change between subjects. Three major clusters of subjects (columns) are broadly grouped as High ISG expression (left), Mid (middle) and Low (right). Subject groupings are represented by yellow (healthy) and blue (ARDS) blocks at the profile base. Only ARDS patients were contained within the Low ISG expression subject cluster. When these genes were ranked for extent of variance of expression using relative size of the standard deviation between subjects, the genes with the largest variance were identified as MX1, ISG15, IFIT1, and IFIT3 (identified by shading). (B) A Principal Component Analysis identified the same 4 genes that comprised nearly all of the variability between subjects in Panel A.

