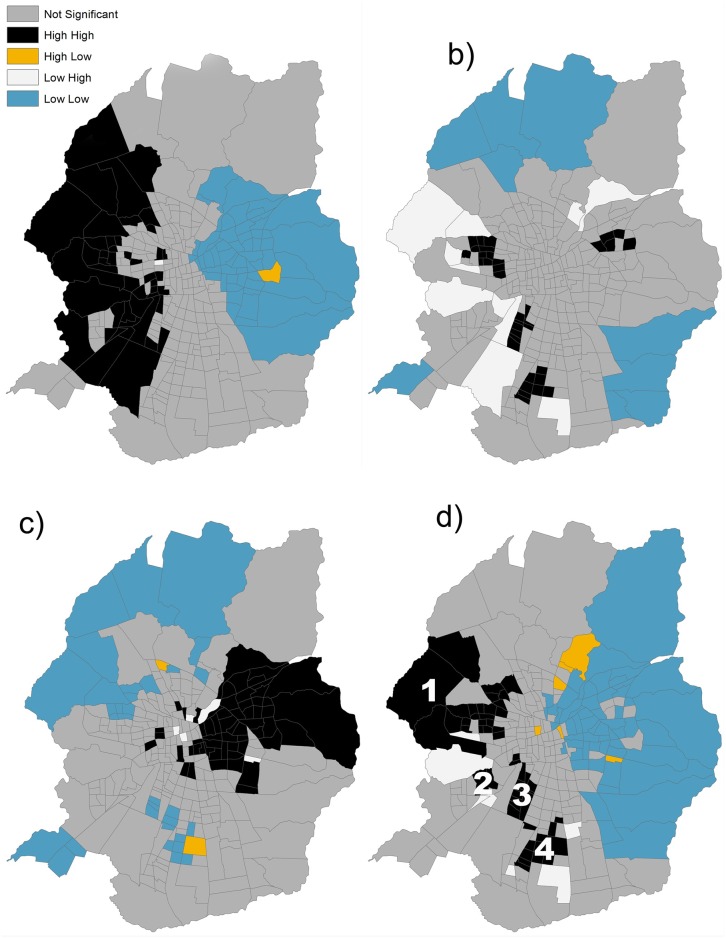
Fig 6. Cluster analysis.
Anselin I Moran for exposure a), sensitivity b), adaptive capacity c) and HVI d). The four clusters of high HVI values are indicated in caption d) with the number 1, 2, 3 and 4. High High for a statistically significant (0.05 level) cluster of positive high values (z-scores) and Low Low for a statistically significant (0.05 level) cluster of positive low values. Statistically significant spatial outliers (0.05 level) are indicated by negative z-scores: High Low if the feature has a high value and is surrounded by features with low values and Low High if the feature has a low value and is surrounded by features with high values.

