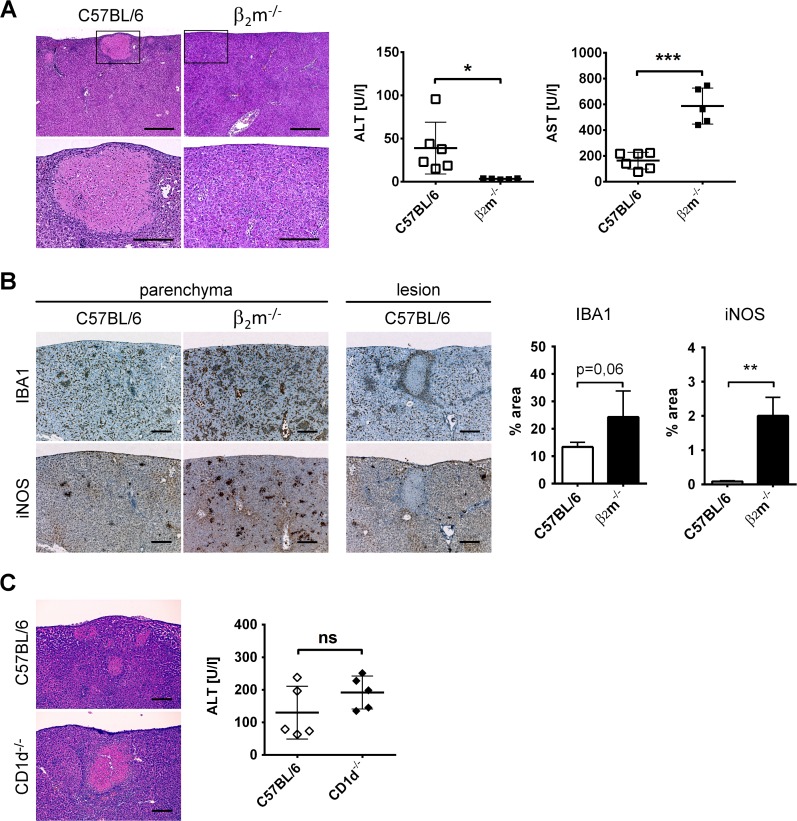
Fig 4. Hepatocellular injury is mediated by CD8+ T cells and triggers macrophage organization.
A-B, β2m-/- mice or C57BL/6 controls were footpad-infected with O. tsutsugamushi. 16 days p.i. the mice were sacrificed. A, H&E stained liver sections. Rectangles in upper panels indicate zones of higher magnification (lower panels). Scale bars, upper panels: 500 μm, lower panels: 200μm. Images show representative regions. The graphs show serum ALT (left) or serum AST (right) levels. Data are pooled from two independent experiments (n = 6) and analyzed by student’s t-tests. B, Consecutive liver sections stained with antibody against IBA1 (upper panels) or iNOS (lower panels). Scale bars: 200 μm. Images show representative regions. Graphs show percentages of stain+ areas per total tissue area in the parenchyma. For quantification 4 representative regions were chosen from each mouse (n = 3). C, CD1d-/- mice or C57BL/6 controls were footpad-infected with O. tsutsugamushi. 16 days p.i. the mice were sacrificed. Images show representative regions of H&E stained liver sections (n = 5). Scale bars: 200 μm. The graph shows serum ALT levels (means +SD, n = 5). Data were analyzed by student’s t-tests. A-C, ns: not significant; * p<0.05; ** p<0.01; *** p<0.001.

