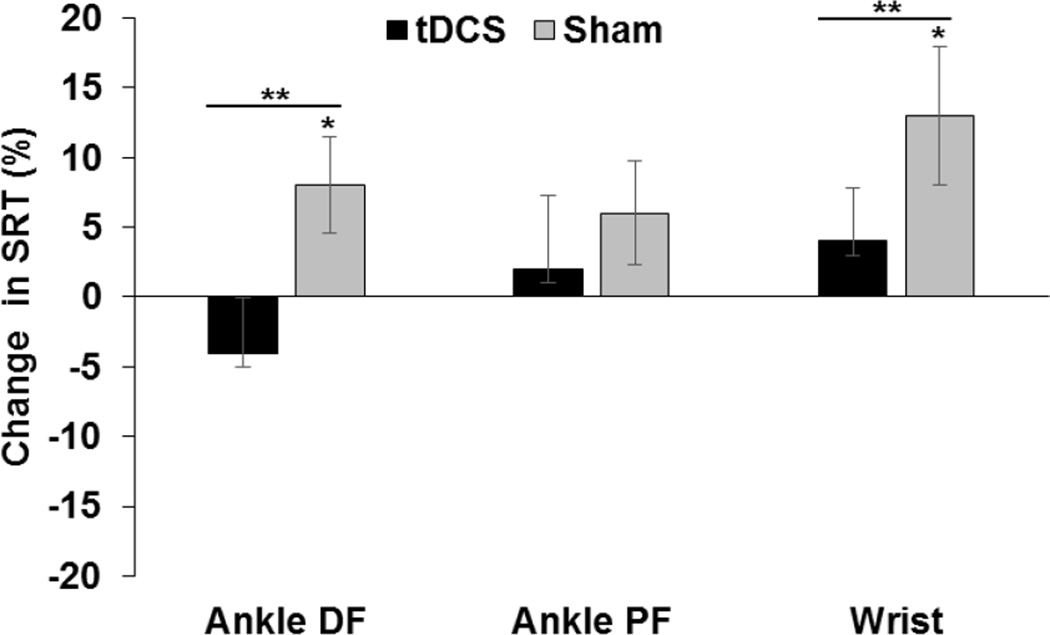
Figure 2. Simple Reaction Time.
Mean percentage changes in simple reaction time (SRT) induced by anodal (solids black bars) and sham (grey bars) tDCS for ankle dorsiflexion (DF), ankle plantarflexion (PF) and wrist extension are shown. * indicates a significant difference (p<0.05) between Pre and Post time points within each stimulation condition (post hoc effect). ** indicates a significant difference (p<0.05) between Anodal and Sham conditions for normalized RT.

