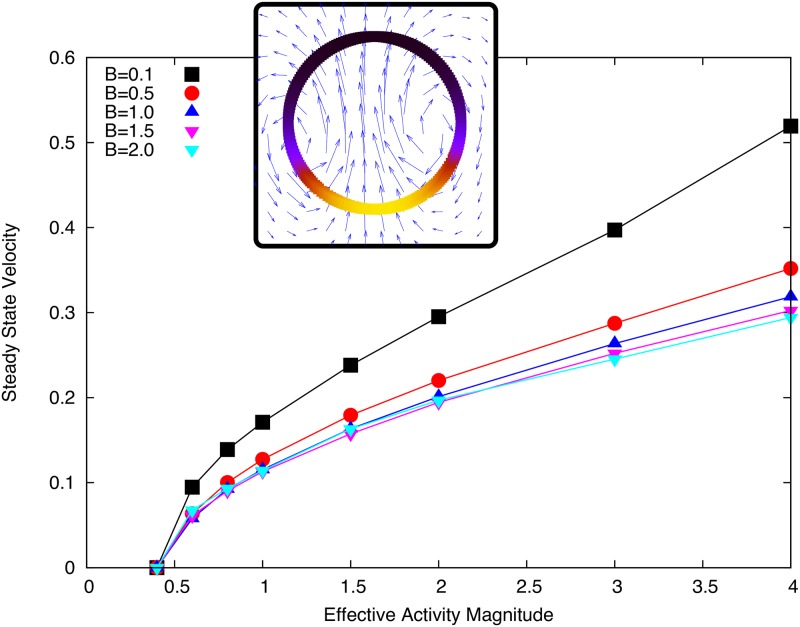
Fig 3. Final droplet velocity plotted against the effective activity for different values of B.
Inset: Droplet swimming steady state, coloured interface shows concentration (black to yellow: low to high) and vector field shows flow field scaled for visibility. Simulation parameters as listed in Tables 1 and 2 with D = 0.1 and γ = 1.

