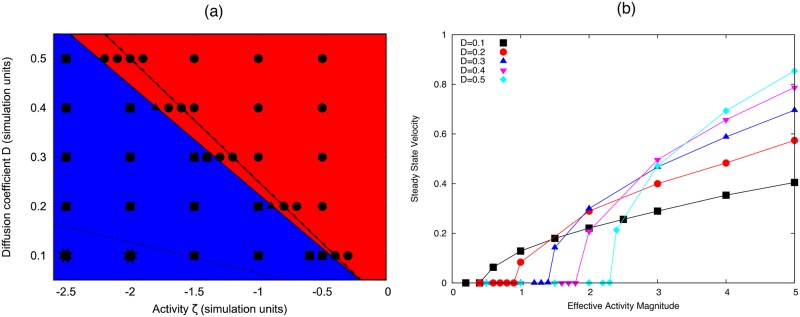
Fig 4.
(a) Phase diagram for transition to motile phase with respect to activity and diffusion parameters on the interface. The red region (circles) show simulations where the droplet remains stationary, the blue region (squares) shows simulations where the droplet swims with a single concentration peak. The simulations indicated by stars show where initially the concentration forms two peaks before coalescing into the stable swimming state. (b) Steady state swimming speed versus active for difference values of the diffusion coefficient D. Simulation parameters: B = 0.5; γ0 = η = R0 = c0 = 1.

