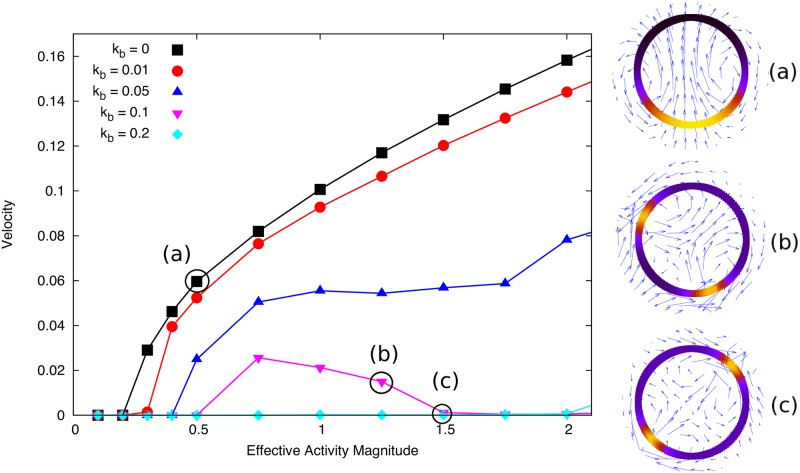
Fig 5. Steady state velocity versus over a range of contractile activity values for different binding rates kb = koff = kon.
Insets show steady state configurations with concentration on interface shown by colour density (black to yellow) and blue arrows show the velocity. Higher binding rates reduce the droplet speed and enables the formation of two concentration peaks (see insets (b) and (c)). Simulation parameters: Db = 0.5, D = 0.05, B = 0.5, γ0 = η = R0 = c0 = 1.

