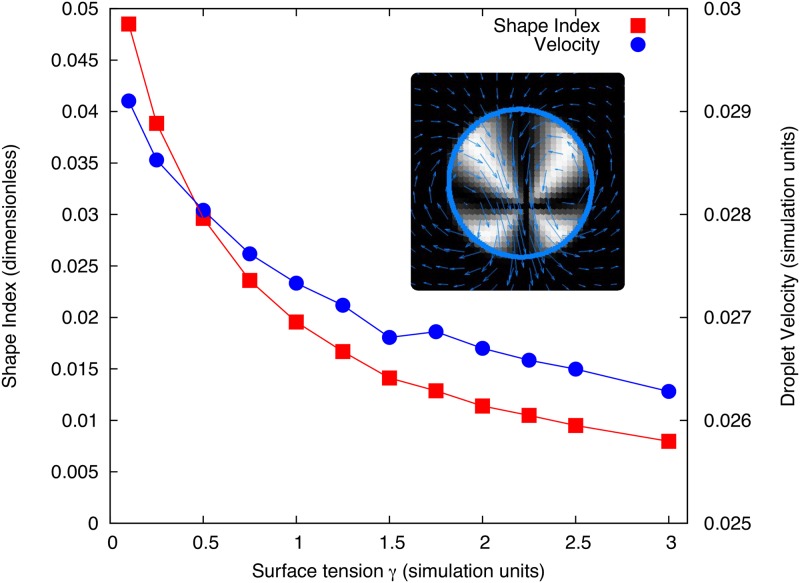
Fig 7. Final droplet speed (right axis) and k = 2 mode shape parameter (calculated as from Eqs (25) and (26) at time t = T, left axis) plotted against droplet surface tension.
The simulations use ζΔμ = 1.5 and ν = 1.1. Inset shows the swimming steady state for γ = 1 where the shading is a Schlieren texture representation of the polarisation field for crossed x-y polarisers such that dark regions represent areas where the polarisation is parallel or antiparallel to the x or y direction (or isotropic as is the case outside the droplet). The blue arrows show the flow field in the fluid (averaged over neighbouring points for clarity), while the blue line traces the droplet interface. Other parameters were set as listed in Tables 1 and 3 with K = 0.1.

