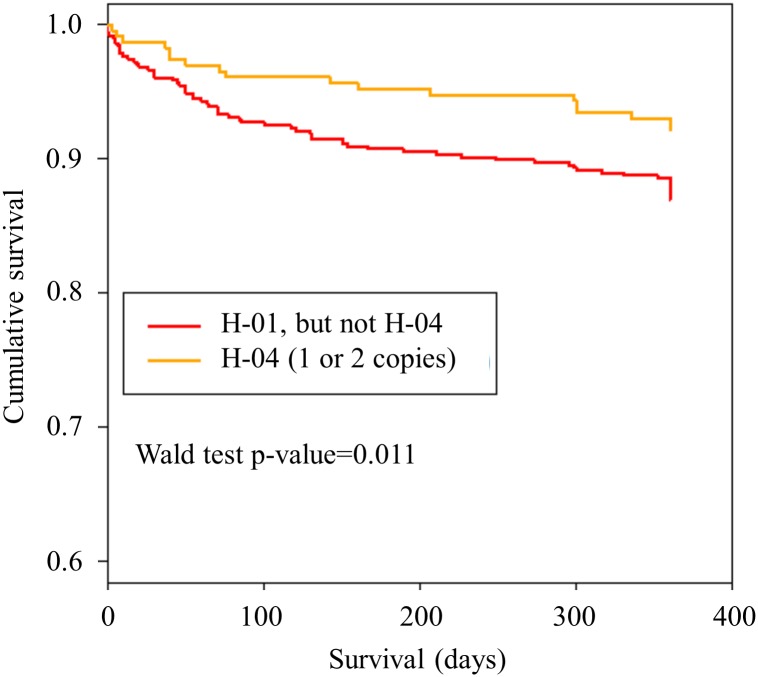
Fig 3. Kaplan-Meier curves showing cumulative survival (combined endpoint all-cause death and/or MI and/or ischemic stroke) stratified according to carriers of reference haplotype H-01 and haplotype H-04 (applying a dominant haplotype model).
Wald test p-value refers to our multivariate Cox regression for SDF1 haplotypes (see Table 5). Red = carriers of 1 or 2 copies of H-01, but not H-04, Orange = carriers of 1 or 2 copies of H-04.

