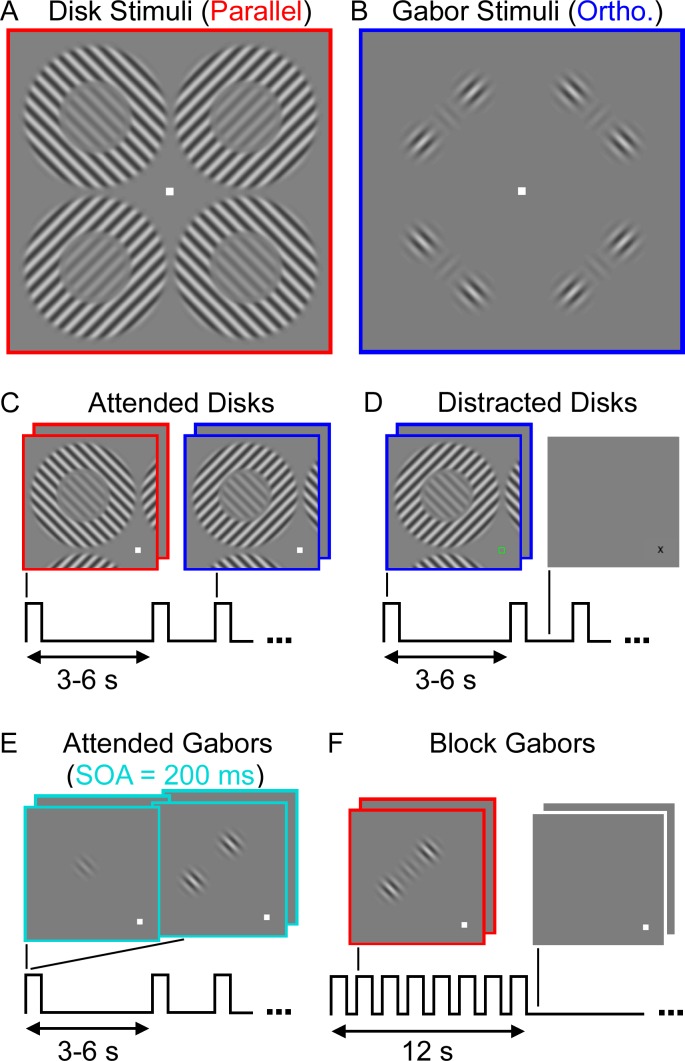
Figure 1.
Stimuli and presentation paradigms. (A) Disks stimuli. (B) Gabors stimuli. (C) Attended event-related paradigm, showing Disks stimuli in one quadrant. Two overlapping panels are shown for each example stimulus to illustrate the two stimulus presentation intervals in each trial. The boxcar function at the bottom illustrates the event-related paradigm (trials occurred every 3–6 s). (D) Distracting fixation paradigm. Note the fixation task timing is independent from that of the peripheral gratings (Disks shown). (E) An illustration of the 200-ms SOA between targets and surrounds in the Attended Gabors experiment. Target and flanking Gabors are shown in separate panels to indicate the asynchrony. (F) Blocked paradigm from the Block Gabors experiment with block timing illustrated by the clustered boxcar function (one block comprised eight trials, 1.5 s each).

