Figure 3.
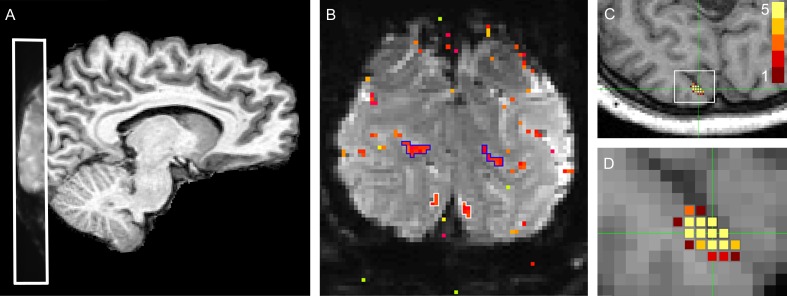
Functional coverage, EPI images and ROI localization. (A) Sagittal view of structural MRI with EPI data overlaid to show imaging coverage and alignment. Functional slice prescription outlined in white. (B) Representative functional data, single coronal slice in a single subject. Color overlay: voxels with coherence > 0.3 and peak response lag between 6–10 s (color indicates phase, with yellow being more delayed). V1 target ROIs (ventral, bilateral) are outlined in white, V2 target ROIs (dorsal, bilateral) in blue. (C) Axial view of structural MRI showing resampled positions for left ventral sub-ROI in V1 for five experiments in one subject. Voxels included in the sub-ROI are marked with colored squares. The color for each voxel indicates the number of experiments in which it was included in the sub-ROI (color bar at top right). Green crosshairs indicate the center of mass across experiments; white box indicates the region magnified in (D).

