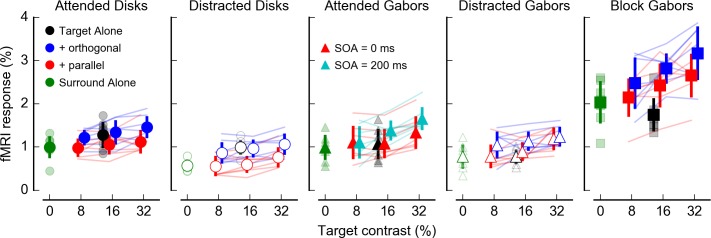
Figure 4.
Responses in V1 ROIs for all experiments. Responses were calculated as percentage signal change relative to presentation of a mean gray screen. Pale lines and symbols indicate individual subject responses (n = 7). Symbol shape corresponds to stimulus geometry and presentation paradigm (indicated in titles). Open symbols indicate attention withdrawn from stimulus by a fixation task (see Methods, “Distracted Disks experiment”). Filled symbols indicate data acquired while subjects were engaged in a 2IFC contrast discrimination task, monitoring all four target locations for a contrast increment. Symbols are plotted with small offsets along the x-axis, here and in the following figures, to reduce overlap and improve visibility. Error bars indicate standard deviation.

