
Figure 3.
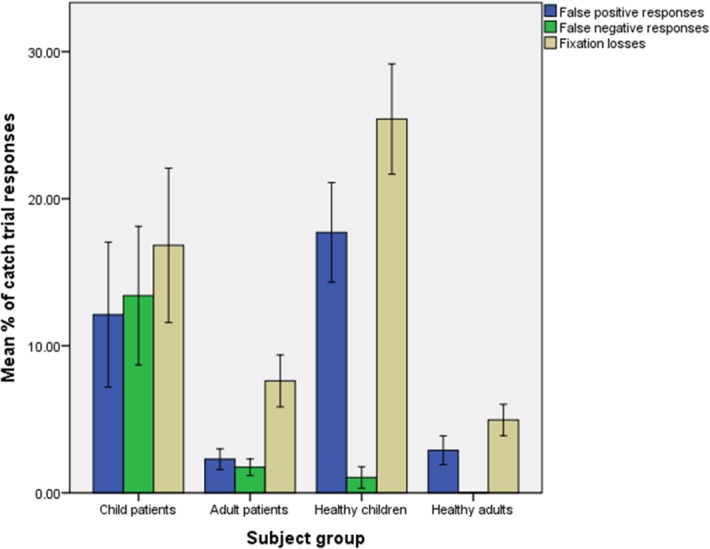
Humphrey Field Analyser reliability index responses. Data shown is the mean of the test reliability index rates (percentage false-positive responses, false-negative responses, and fixation losses) ±1 standard error of the mean.
Official websites use .gov
A
.gov website belongs to an official
government organization in the United States.
Secure .gov websites use HTTPS
A lock (
) or https:// means you've safely
connected to the .gov website. Share sensitive
information only on official, secure websites.
Humphrey Field Analyser reliability index responses. Data shown is the mean of the test reliability index rates (percentage false-positive responses, false-negative responses, and fixation losses) ±1 standard error of the mean.