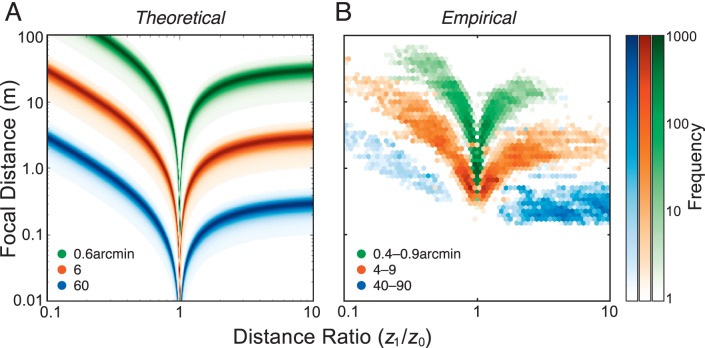
Figure 7.
The probability of different amounts of defocus blur given the distance to which the eye is focused (z0) and the ratio of the object distance divided by the focal distance (z1/z0). (A) The theoretical probability distributions for different amounts of blur (green for 0.6 arcmin, orange for 6 arcmin, and blue for 60 arcmin). We assumed a Gaussian distribution of pupil diameters with a mean of 5.8 mm and standard deviation of 1.1 mm; these numbers are consistent with the diameters measured when our subjects were performing the natural tasks. Higher probabilities are indicated by darker colors. As the distance ratio approaches 1, the object moves closer to the focal distance. There is a singularity at a distance ratio of 1 because the object by definition is in focus at that distance. (B) The empirical distributions of focal distance and distance ratio given different amounts of blur. Different ranges of blur are represented by green (0.4–0.9 arcmin), orange (4–9 arcmin), and blue (40–90 arcmin). The number of observations for each combination of focal and relative distance is represented by the darkness of the color, as indicated by the color bars on the right. The data were binned with a range of ∼1/15 log unit in focal distance and ∼1/30 log unit in distance ratio.

