Figure 9.
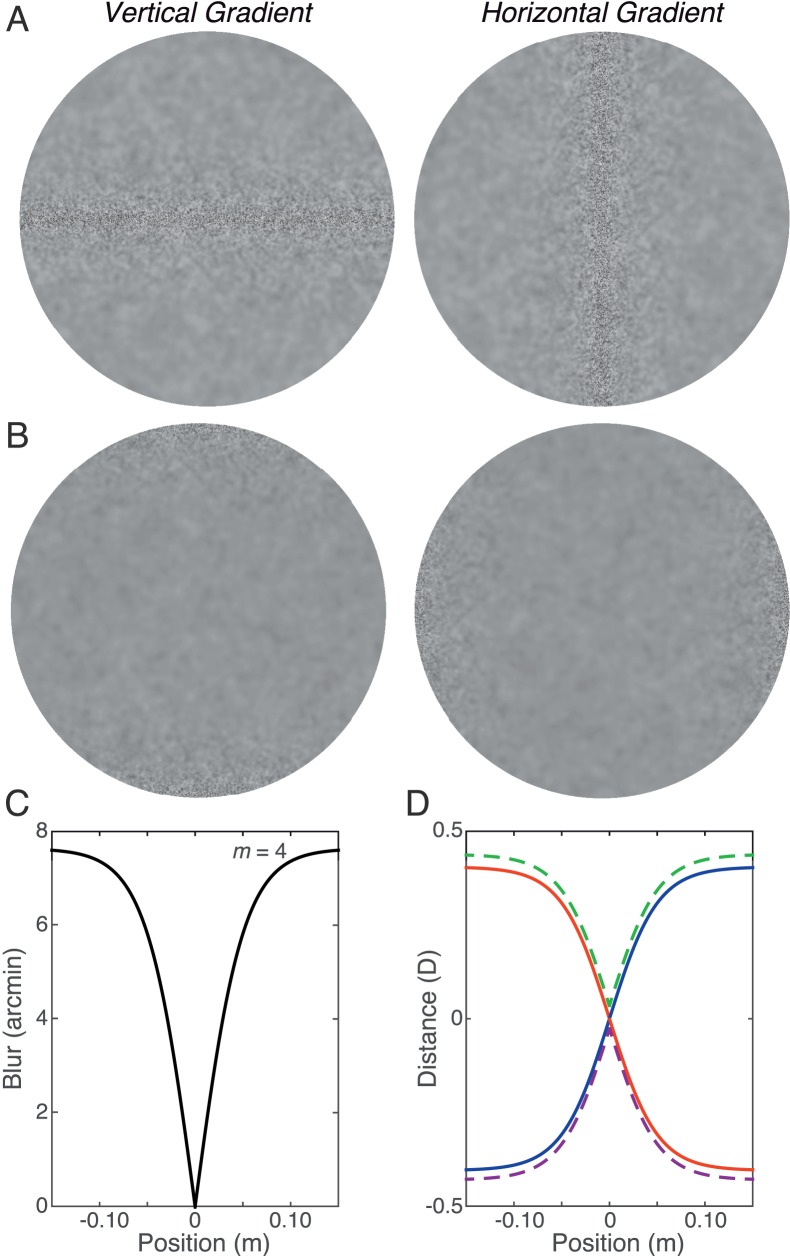
Experimental stimuli and corresponding shapes. (A) White-noise textures with blur gradients. The one on the left has a vertical blur gradient and the one on the right a horizontal blur gradient. In both cases, the blur kernel was zero in the middle of the image and increased monotonically with eccentricity. (B) White-noise textures with blur gradients but with the blur kernel at zero at the edges of the stimuli. (C) Blur as a function of image position in the experimental stimuli with sharp centers. The value of m (Equation 3) is 4. We converted the Gaussian blur kernels with standard deviation σ into cylindrical blur kernels, so the ordinate is now the diameter of the corresponding cylinder. We made this conversion so that we could calculate the corresponding relative distances with Equation 2. (D) The 3D shapes that would create the blur distribution in panel C. Distance from fixation in diopters is plotted as a function of image position. There are four shapes that are consistent with the blur distribution: (1) a surface slanted top-back (blue), (2) a surface slanted top-forward (red), (3) a convex wedge (green dashed), and (4) a concave wedge (purple dashed). The dashed lines have been displaced slightly vertically to aid visibility.

