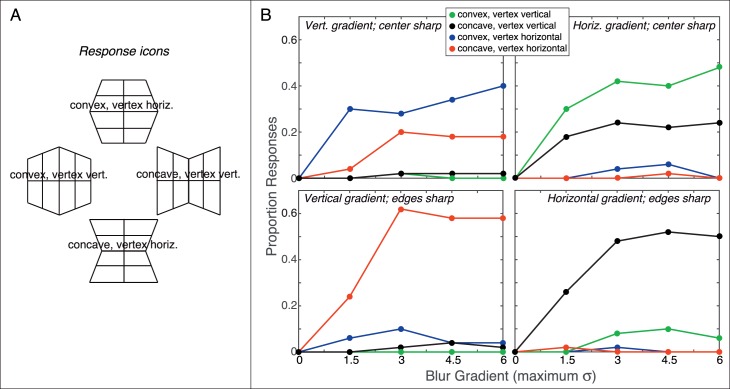
Figure 11.
Blur gradients and perception of wedge 3D shape. (A) Response icons for four wedge-like responses (four of nine possible responses). (B) Experimental results. The panels plot the proportion of responses of a particular category as a function of the magnitude of the blur gradient. The abscissa values are the maximum values of σ in Equation 3. The upper panels show the proportions of responses when the center of the stimulus was sharp and the edges blurred. The lower panels show the response proportions when the edges were sharp and the center blurred. The left panels show the responses when the blur gradient was vertical. The right panels show them when the gradient was horizontal. The data have been averaged across the five observers. We calculated the departure of the data from equal distribution of responses among the geometrically plausible alternatives for each value of m. Specifically, we computed χ2 for the observed responses relative to responses distributed equally among three alternatives. When the blur gradient was vertical, we considered observed responses relative to the alternatives of “flat,” “convex” (horizontal vertex), and “concave” (horizontal vertex). When the gradient was horizontal, we considered responses relative to “flat,” “convex” (vertical vertex), and “concave” (vertical vertex). All χ2 values were statistically significant (p < 0.01), which means that responses were not randomly distributed among the alternatives.

