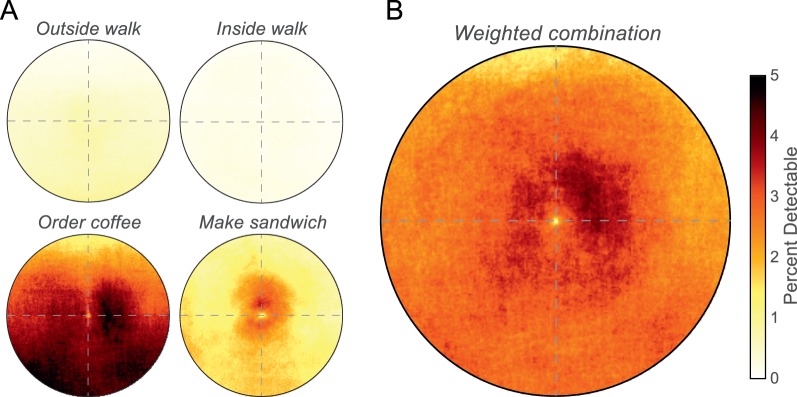
Figure 14.
The percentage of detectable blurs across the visual field. (A) Percentage of detectable blur magnitudes in the central visual field for the four tasks. The diameter of the circles is 20° and the fovea is in the center. Darker colors represent higher percentages (see color bar on far right). (B) Percentage of detectable blur magnitudes in the central visual field for the weighted combination across tasks.

