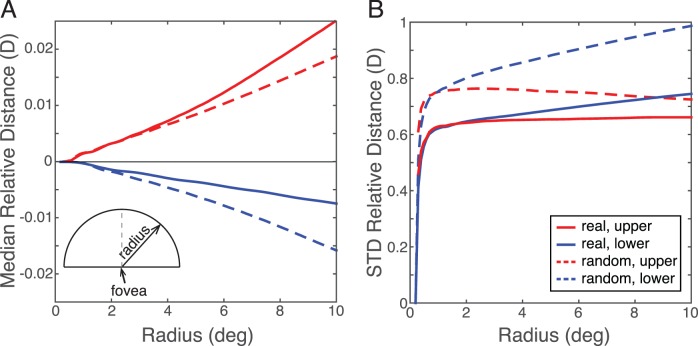
Figure 16.
Medians and standard deviations of relative distance with real and random fixations. (A) Median relative distances in the upper and lower fields plotted as a function of radial distance from the fovea. The medians were computed from all relative distances within the semicircular sampling window. The red and blue curves represent the data from the upper and lower fields, respectively. Solid and dashed curves represent the data from real and random fixations, respectively. (B) Standard deviations of relative distances in the upper and lower fields as a function of distance from fovea. The red and blue curves represent data from the upper and lower fields, respectively. Solid and dashed curves represent data from real and random fixations, respectively.

