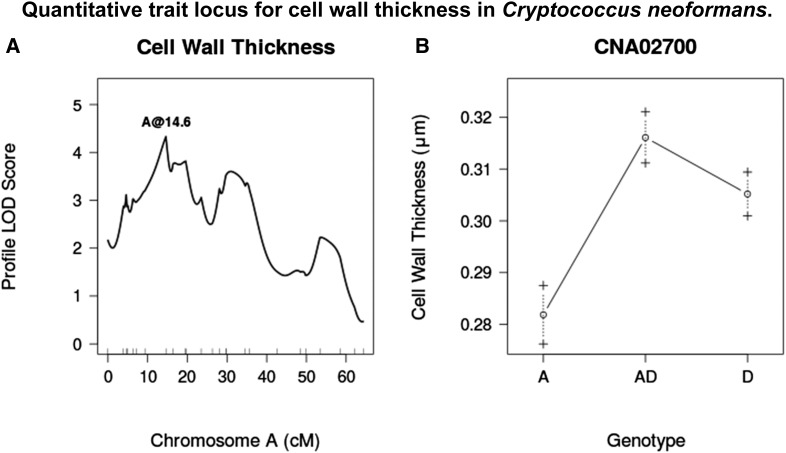
Figure 4.
(A) LOD score profile for a QTL associated with cell wall thickness. (B) Average cell wall thickness for given genotypes at marker CNA02700. Dashed lines represent standard error in the mean. LOD, logarithm of odds; QTL, quantitative trait loci.

