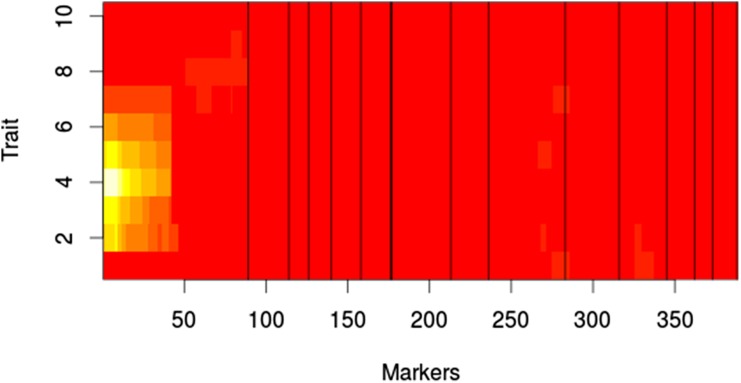
Figure 9.
MQM results for growth with fluconazole in liquid RPMI. White indicates high LOD score. Red indicates low LOD score. X-axis shows log M of fluconazole. Markers represent pseudomarkers placed throughout the linkage map. Chromosomes are indicated by black vertical lines. LOD, logarithm of odds; MQM, multiple QTL mapping; QTL, quantitative trait loci; RPMI, Roswell Park Memorial Institute.

