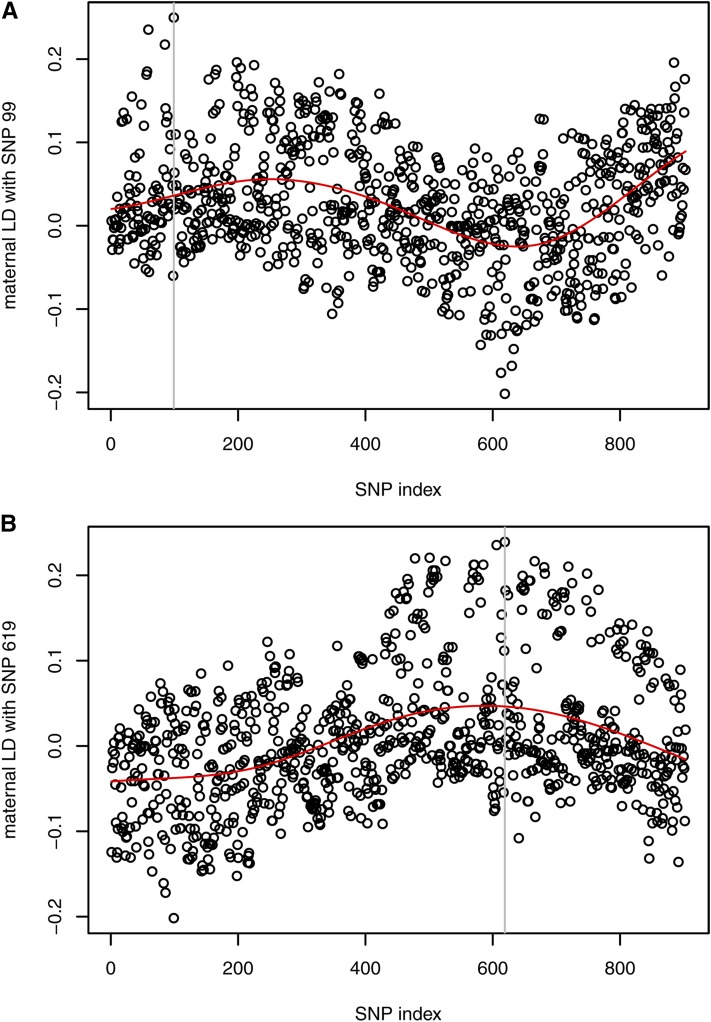
Figure 4.
Estimated maternal LD with two selected SNPs on BTA1 for the real genotypes. The vertical line refers to the SNP with which pairwise LD was calculated. Smoothing via B-splines visualizes the trend of the data (red curves). (A) LD pattern shows a potential error in the marker map. (B) Maximum LD was observed around the reference SNP indicating correct positioning.

