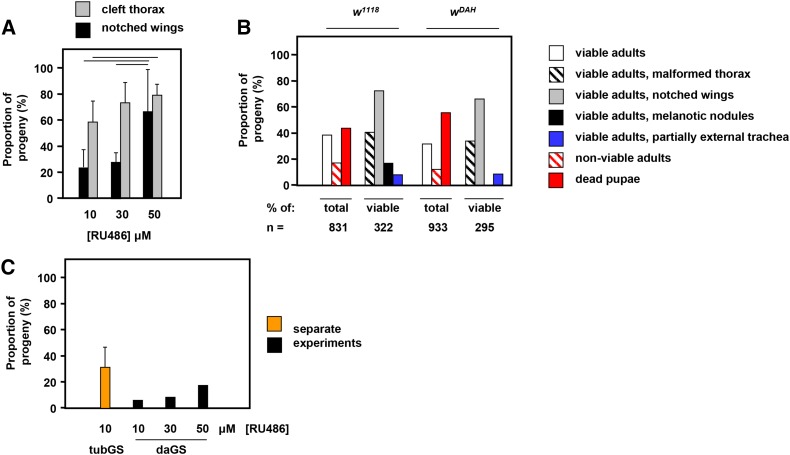
Figure 3.
Effects of drug concentration, driver, and genetic background on developmental abnormalities induced by GeneSwitch plus RU486. (A) Proportion of viable adult progeny exhibiting major phenotypic abnormalities as indicated, at different doses of RU486, in the Oregon R genetic background. Mean ± SD for sets of n ≥ 4 independent vials. Horizontal bars denote significant differences for a given phenotypic trait between the stated drug concentrations (Student’s t-test, P < 0.05). (B) Proportion of progeny in different phenotypic classes of tubGS flies in the w1118 and wDAH backgrounds grown at 10 μM RU486. Note that the adult phenotypes are scored as percentages of the viable adult flies that eclosed. Total numbers of pupae analyzed in each large-scale experiment (n) as indicated. (C) Proportion of adult progeny showing bristle abnormalities, as illustrated in Figure S1, in flies grown at the indicated doses of RU486, bearing the tubGS or daGS drivers as indicated. Large-scale experiment using the daGS driver analyzed n = 508 individual adult flies (10 μM), n = 758 (30 μM), and n = 246 (50 μM). The data for the tubGS driver at 10 μM is the mean ± SD for three independent experiments (n = 89, 284, and 157 adults analyzed). See also Figure S2. daGS, daughterless-GeneSwitch; SD, standard deviation; tubGS; α-tubulin-GeneSwitch.

