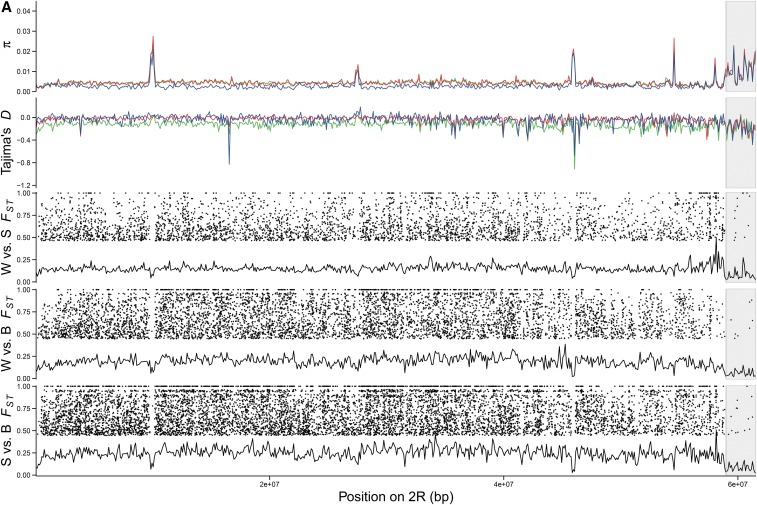
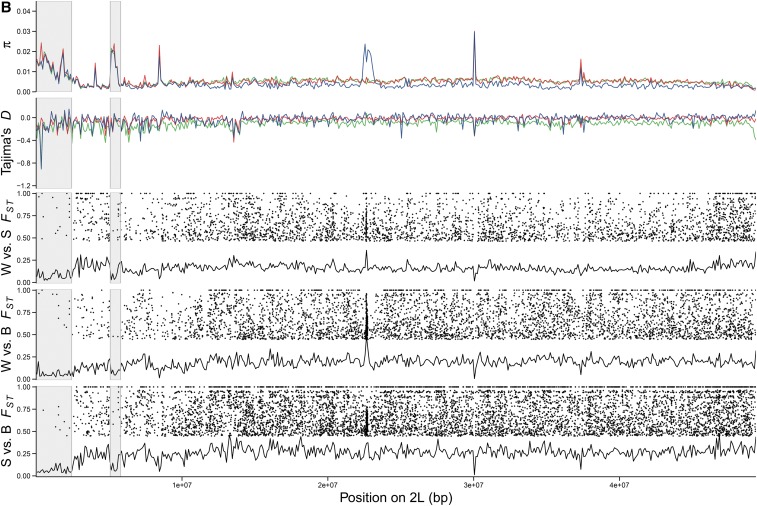
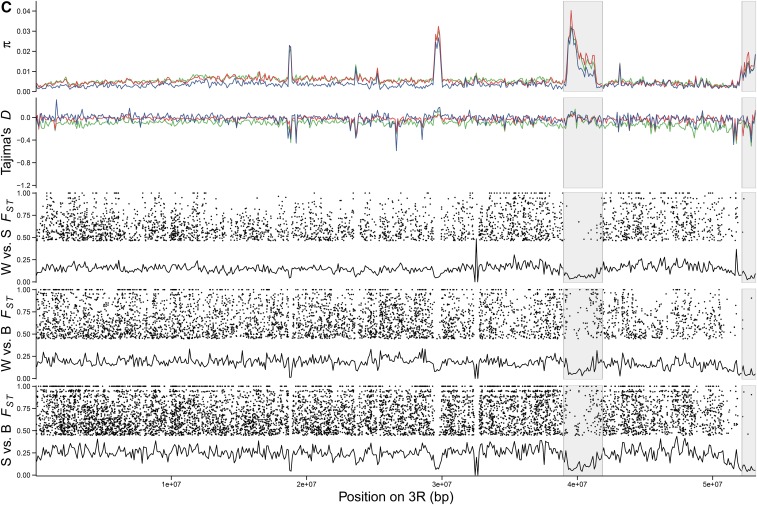
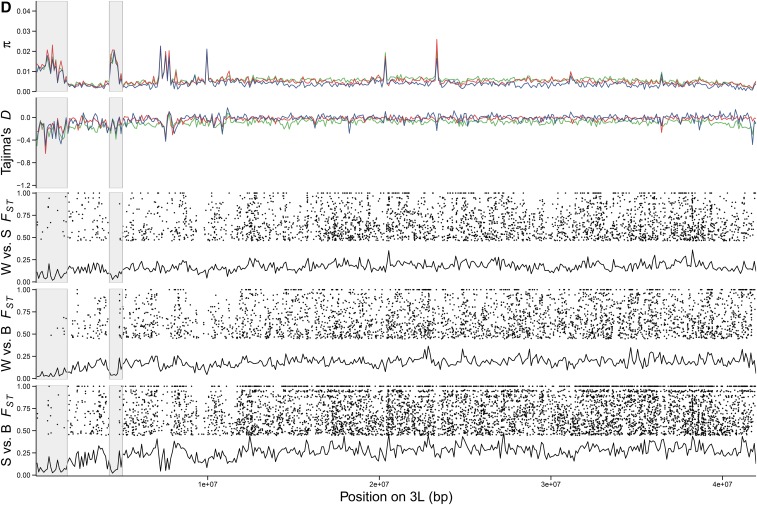
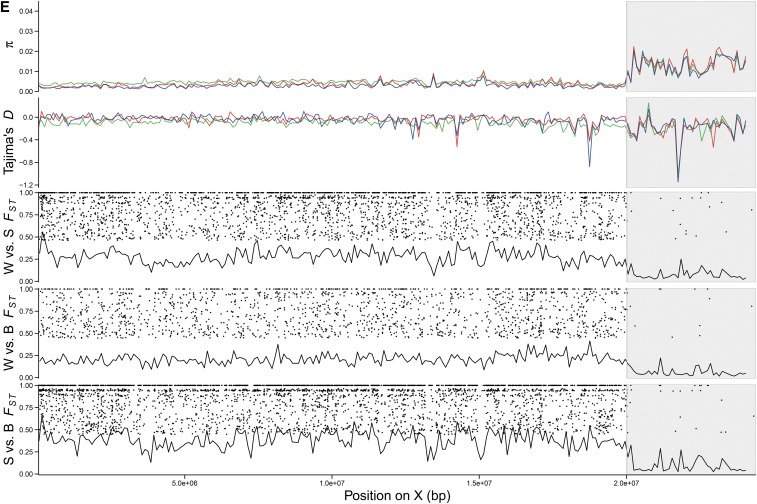
Figure 3.
Line plots illustrate genome-wide nucleotide diversity (π) and Tajima’s D estimates for each chromosome arm and population based upon nonoverlapping, 100 kb sliding windows. (A–E) Green lines represent An. melas West, red lines represent An. melas South, and blue lines represent An. melas Bioko. FST plots are presented for each pairwise population comparison: An. melas West vs. South (W vs. S), West vs. Bioko (W vs. B), and South vs. Bioko (S vs. B). The solid line indicates FST calculated for nonoverlapping, 100 kb sliding windows, and dots indicate significant FST SNPs. Vertical gray bars indicate regions of heterochromatin in the An. gambiae genome that were not included in the calculation of summary statistics.

