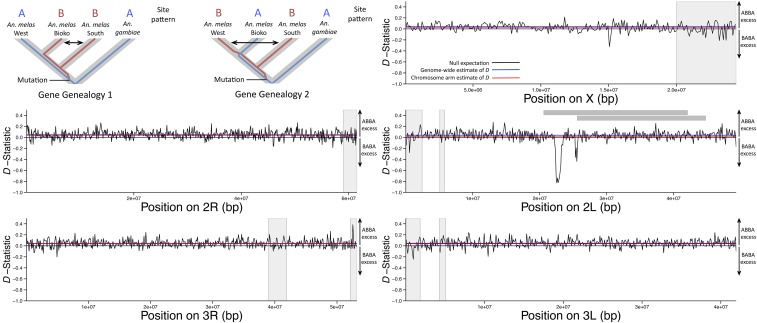
Figure 4.
Line plots illustrate genome-wide values of Patterson’s D-statistic for each chromosome arm for the An. melas population tree {[(West,Bioko)South]An. gambiae}. Positive values indicate an excess of ABBA patterns and negative values indicate a biased proportion of BABA patterns. Horizontal black lines indicate the null expectation, no ABBA or BABA excess (D = 0). Horizontal blue lines indicate the genome-wide estimate of Patterson’s D, and horizontal red lines indicate the average Patterson’s D for each chromosome arm. Vertical gray bars indicate regions of heterochromatin in the An. gambiae genome that were not included in the calculation of summary statistics. Horizontal gray bars in the chromosome arm 2L panel indicate the locations of the 2La/+ (top) and 2La2/+ (bottom) inversions. The top left panel demonstrates the ABBA vs. BABA patterns in the context of the An. melas tree, where an ABBA pattern indicates introgression between An. melas Bioko and South, and a BABA pattern indicates introgression between An. melas West and South (arrows).

