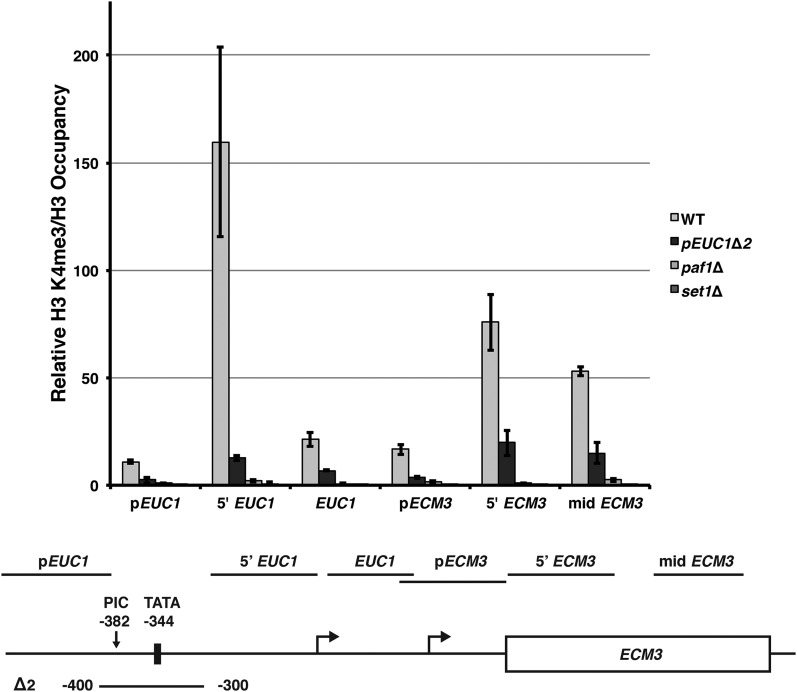
Figure 5.
EUC1 promoter deletion reduces H3K4me3 levels across the ECM3 locus. ChIP analysis of H3 K4me3 levels at the ECM3 locus. Immunoprecipitations were performed in biological triplicate using chromatin isolated from WT (FY4, FY5, and YJ1125), pEUC1∆2 (YJ1133, YJ1134, and YJ1135), paf1∆ (YJ807, YJ809, and KY1701), and set1∆ (KY1755, KY1715, and KY2722) strains. Enrichment of H3 K4me3 relative to input DNA was measured by qPCR and normalized to H3 occupancy. Error bars represent the SEM of three biological replicates. The relative locations of qPCR primers are indicated on the diagram below (the mid ECM3 primer set is not shown to scale). ChIP, chromatin immunoprecipitation; PIC, preinitiation complex; qPCR, quantitative polymerase chain reaction; WT, wild-type.

