Figure 6.
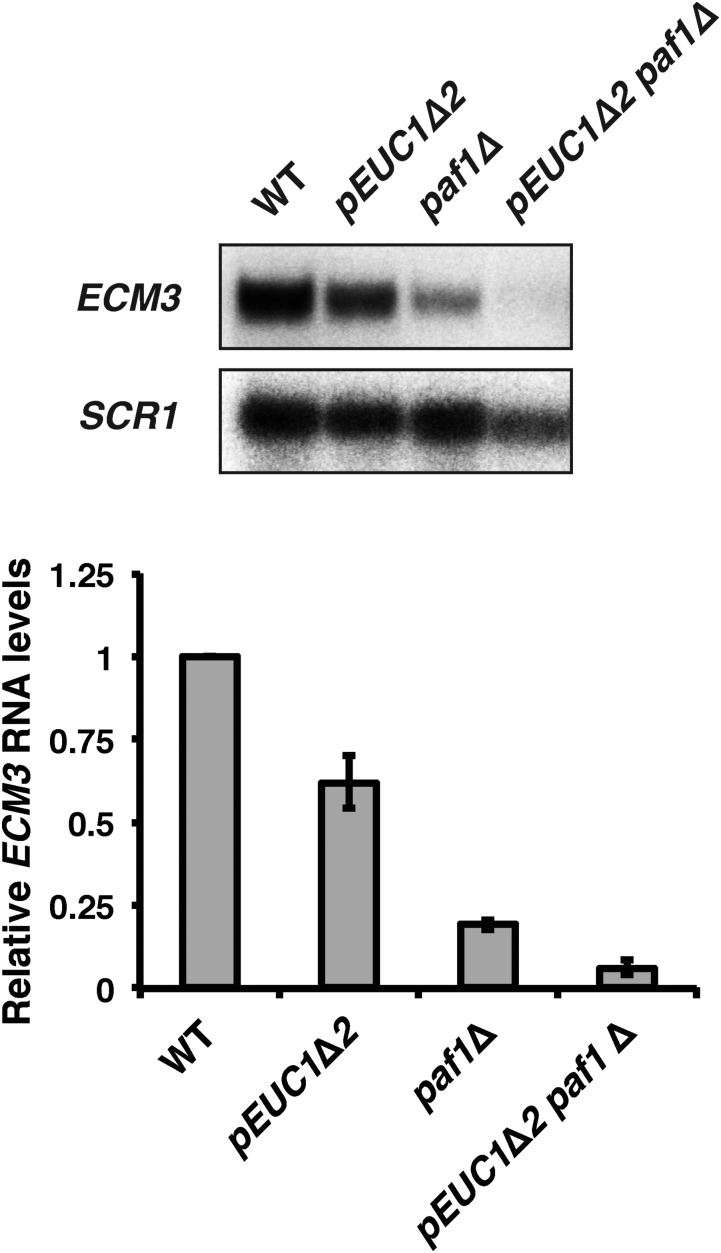
The Paf1 complex and EUC1 impact ECM3 expression through independent pathways. Representative northern blot analysis of ECM3 transcript levels in a pEUC1∆2 strain (YJ1135), a paf1∆ strain (KY1701), and a pEUC1∆2 paf1∆ double mutant strain (YJ1138) compared to a WT strain (YJ1125). Bar graphs show the average ECM3 mRNA levels relative to WT strains (set to 1) from three biological replicates. Error bars represent the SEM. SCR1 serves as a loading control. WT, wild-type.

